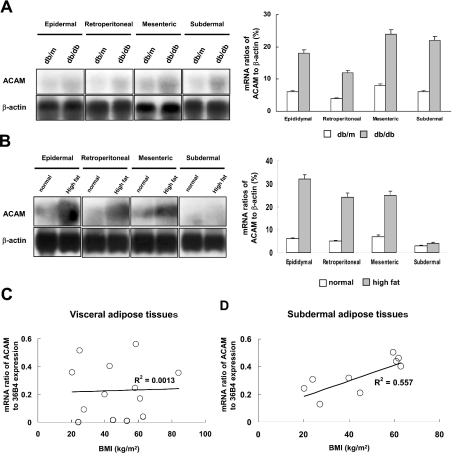
Figure 6. ACAM mRNA expression in obese animal models and human subjects.
(A) Northern blot analyses were performed by using RNA extracted from db/db and db/m mice at 12 weeks of age, and mRNA ratios of ACAM/β-actin (%), measured with densitometer, are indicated. (B) Total RNAs were extracted from WATs of DIO ICR mice and control lean mice at 16 weeks of age, and Northern blot analyses show the ACAM mRNA expression increases in visceral adipose tissues of DIO mice compared with lean control mice. (C) There is no significant correlation between BMI and ACAM mRNA expression level in human visceral adipose tissues. (D) A significant positive correlation is observed between BMI and ACAM mRNA expression level in human subdermal adipose tissues (R2=0.557, P<0.01, n=9). In (C) and (D), the relative abundance of the mRNAs is standardized with 36B4 mRNA as the invariant control.

