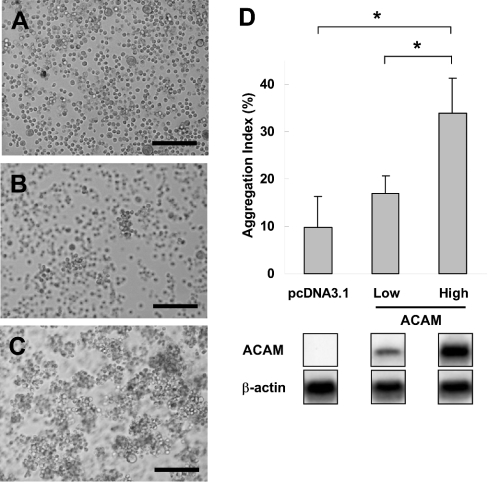
Figure 8. Aggregation assay using ACAM stably transfected CHO-K1 cells.
(A) pcDNA3.1 transfected CHO-K1 cells, as control, show scattered single cell suspension. (B) In low expression cell line, small cell aggregates consisting of 10-15 cells are observed. (C) Larger aggregates are found in high expression cell line after 90 min of incubation. (D) The initial particle number (N0), identical to the total number of the cells added to the medium, and the particle number at 90 min of incubation (N90) was measured with Coulter counter. The aggregation index, (N0−N90)/N0, is significantly higher in the high expression cell line (33.8±7.4%) than pcDNA3.1-transfected CHO-K1 cells (9.8±6.4%).The results are expressed as the means±S.D; *P<0.001. Scale bars, 200 μm.

