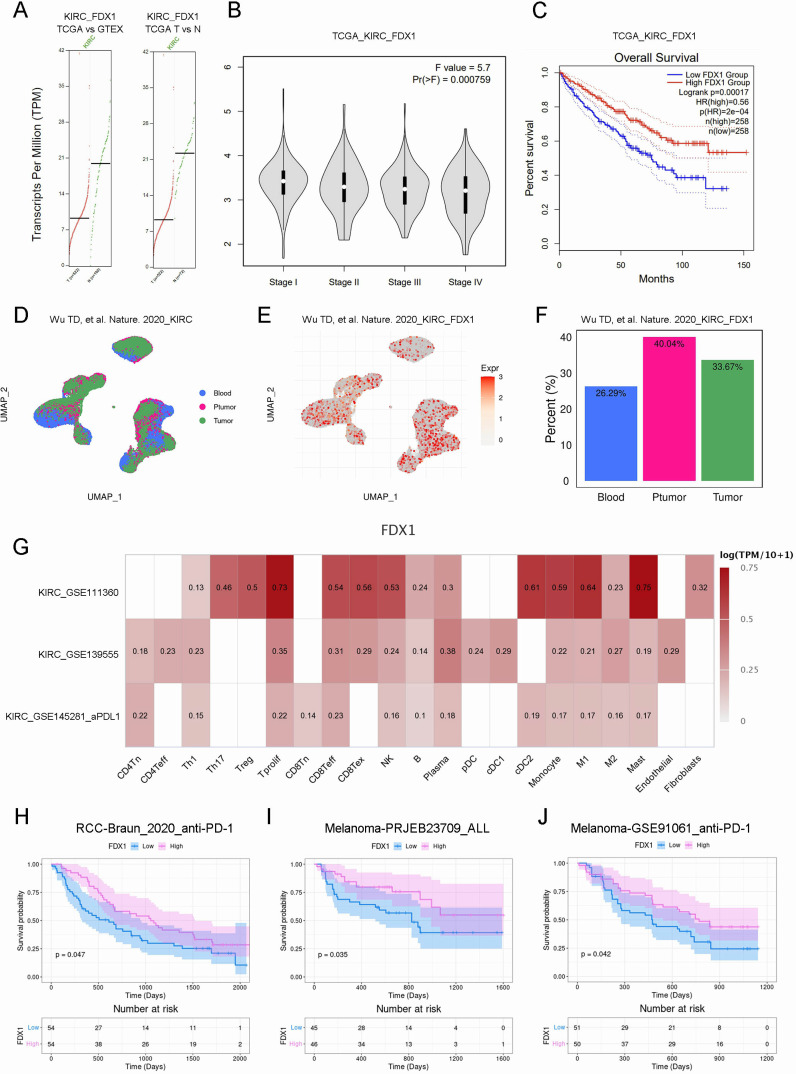
Figure 4.
FDX1 expression was correlated with prognosis in KIRC patients. (A). The mRNA expression of FDX1 in normal or cancer tissues. (B). The violin plot showed the correlation. (C). The correlation of FDX1 with OS in KIRC. (D-F). The UMAP analyze of FDX1 expression of single-cell sequencing samples. (G). Heat map showed the correlation. (H-J). The Kaplan–Meier survival curve showed the survival probability.

