
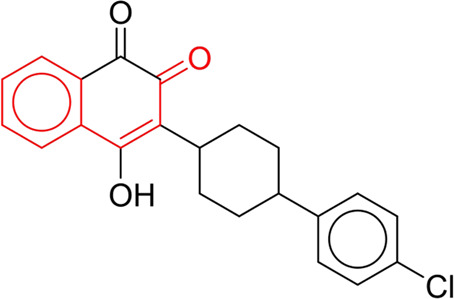
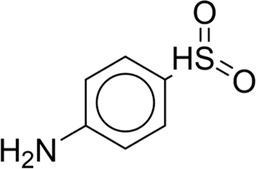
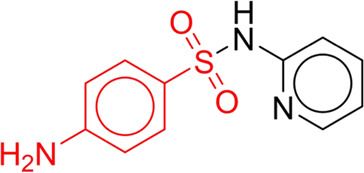
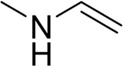
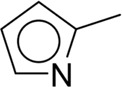
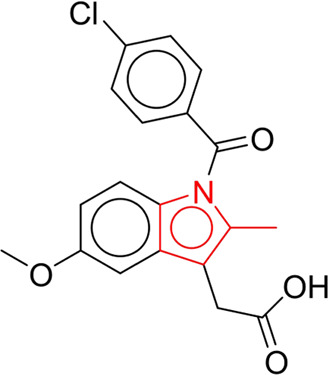
TABLE 7.
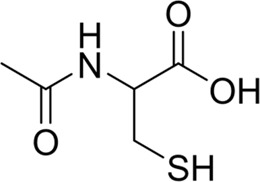
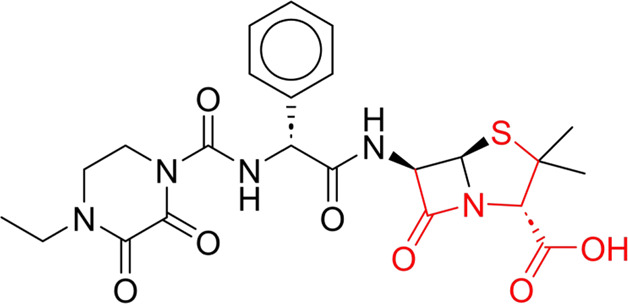
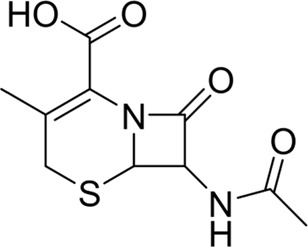
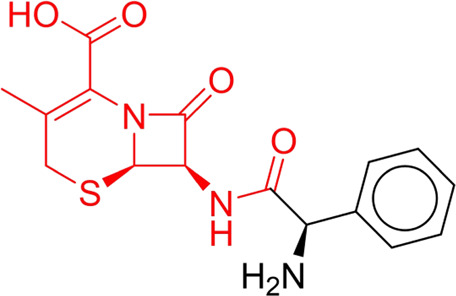
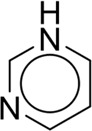
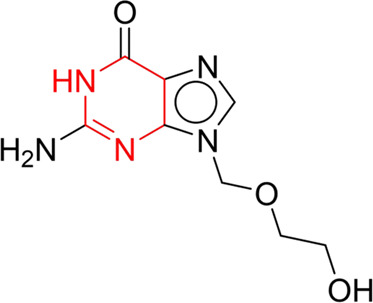
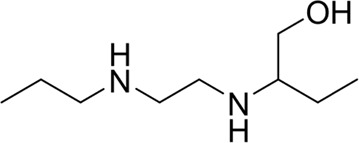
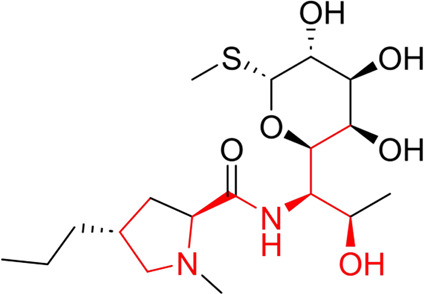
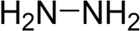
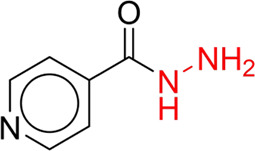
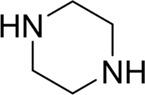
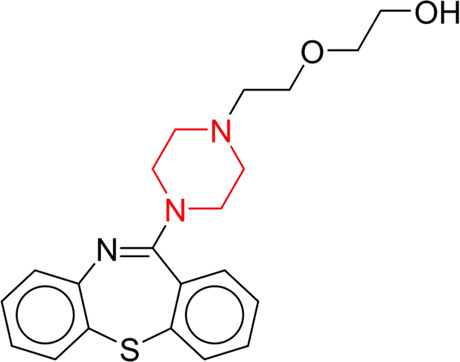
Structural alerts associated with NCDIA toxicity identified by SARpy software.
| Id | Structure | LR | Representative Structure |
|---|---|---|---|
| 1 |
|
inf |
|
| 2 |
|
inf |
|
| 3 |

|
inf |
|
| 4 |
|
inf |
|
| 5 |
|
39.45 |
|
| 6 |
|
19.73 |
|
| 7 |
|
14.79 |
|
| 8 |
|
11.1 |
|
| 9 |
|
11.1 |

|
| 10 |
|
8.63 |
|
| 11 |
|
6.58 |
|
| 12 |
|
5.75 |
|
| 13 |
|
4.68 |
|
| 14 |
|
4.32 |
|
| 15 |
|
4.11 |
|
| 16 |
|
2.47 |
|