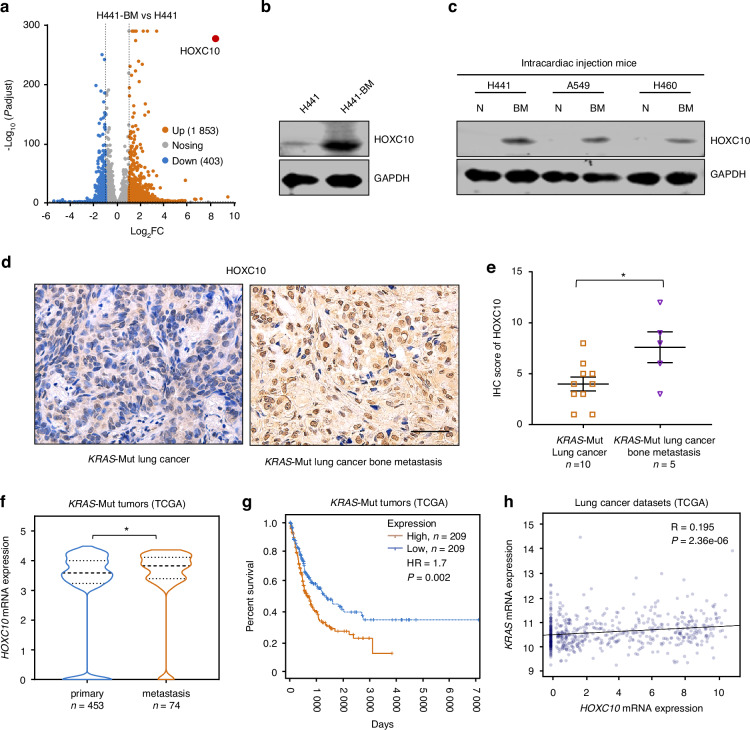
Fig. 1.
HOXC10 expression is associated with pan-KRAS-mutant lung cancer bone metastasis. a Volcano plot illustrating HOXC10 involved in differentially expressed genes. 678 down-regulated genes and 386 up-regulated genes in H441-BM vs. H441 cells. Fold change, >1.5; Padjust, <0.05. b The protein expression levels of HOXC10 in H441-BM (bone metastasis) vs. H441 cells. c The protein expression levels of HOXC10 in adjacent normal tissue and lung cancer bone metastasis tissue after mice intracardiac injection 6 weeks. d Representative IHC images for HOXC10 staining in KRAS-Mutant primary lung cancer and lung cancer bone metastasis samples. Scale bars, 50 μm. e The HOXC10 IHC staining for (n = 15), KRAS-Mut (n = 10) of lung cancer samples and KRAS-Mut (n = 5) of lung cancer bone metastasis samples were quantified. f HOXC10 expression levels in primary (n = 453) and metastasis (n = 74) tissues samples from KRAS mutation patients in the TCGA KRAS mutation Pan cancer dataset. g Kaplan-Meier survival curves for the indicated groups in the TCGA KRAS mutation Pan cancer dataset. HOXC10 high expression group (n = 209) displayed decreased survival compared to that of HOXC10 low expression group (n = 209). h Scatterplot showing the correlation between KRAS mRNA expression levels and HOXC10 mRNA expression levels in the TCGA KRAS mutation lung cancer dataset. R, Pearson’s correlation co-efficient. Data in (e) shown as mean ± s.e.m. Panels (e, f) was performed unpaired two-sided Student’s t test, and (g) performed log-rank test, *P < 0.05

