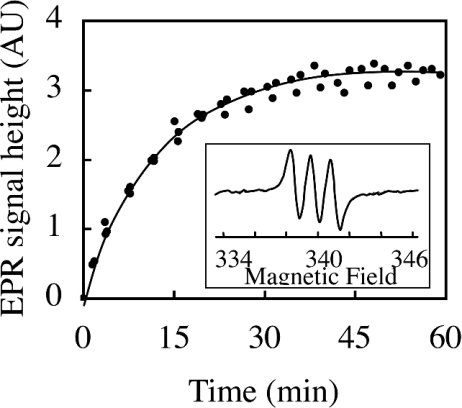
Figure 2. Relationship between the NOM concentration and the height of the EPR signal of (MGD)2–Fe2+–NO complex.
Peak-to-peak height of the first line of the (MGD)2–Fe2+–NO signal in the mixture of (MGD)2–Fe2+ and NOM plotted against time. At the initial time, the mixture of 50 mM MGD, 10 mM FeSO4 and 10 μM NOM in Tris buffer, pH 7.5, was introduced in a flat cell at 298 K. A spectrum was recorded every 1 min using a Bruker EPR spectrometer. The inset shows a typical spectrum obtained after 60 min with 10 μM NOM. The same spectra were obtained immediately with 10 μM GSNO. The EPR triplet signal centred at g=2.04 with a nitrogen hyperfine coupling constant of 1.27 mT is characteristic of (MGD)2–Fe2+–NO.

