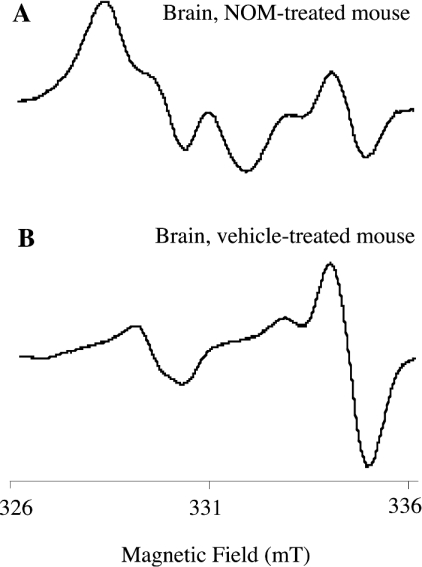
Figure 5. Typical EPR spectra of brains from NOM- and vehicle-treated mice.
The upper spectra were obtained with brain isolated after i.p. injections of NOM (A) and vehicle (B) followed by perfusion. The brain was homogenized with a fresh (MGD)2–Fe2+ complex, and was frozen 30 min later. Spectra were recorded at 77 K on a Magnettech EPR spectrometer. Instrument settings are indicated in the Materials and methods section.

