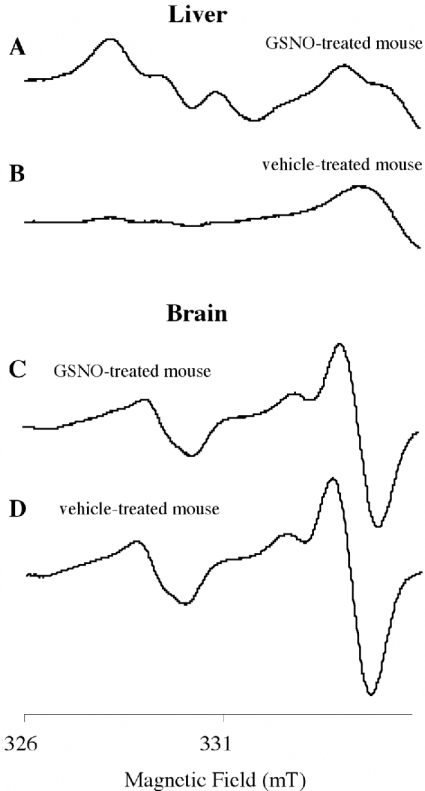
Figure 6. Typical spectra obtained with brain and liver from GSNO- and vehicle-treated mice.
The upper spectra were obtained with liver (A and B) and brain (C and D) isolated after i.p. injections of GSNO (A and C) or vehicle (B and D) followed by perfusion. The liver and the brain were homogenized with a fresh (MGD)2–Fe2+ complex solution. Samples were frozen in 5-mm quartz tubes in liquid nitrogen, and spectra were recorded at 77 K on a Magnettech EPR spectrometer. Instrument settings are indicated in the Materials and methods section.

