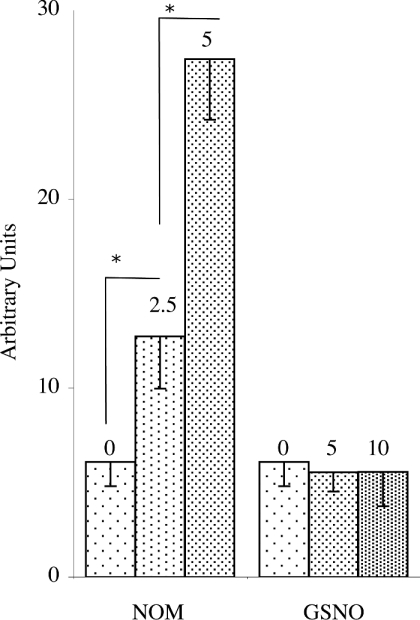
Figure 8. Intensities of the EPR signals obtained with brains isolated from NOM- or GSNO-treated mice.
The series of columns correspond to ex vivo experiments. Mice were anaesthetized 7 min after i.p. injections of vehicle, 2.5 or 5 μmol of NOM, and 5 or 10 μmol of GSNO, and then perfused. Brains were homogenized in a fresh (MGD)2–Fe2+ solution. EPR measurements were made at 77 K. When vehicle and GSNO were administered, the two first lines of the (MGD)2–Fe2+–NO spectra were overlapped by a (MGD)2–Cu2+ signal. When NOM was administered, the increase in the peak-to-peak height of the two first lines of the EPR spectra, expressed in arbitrary units (means±S.D. from at least three experiments), was attributed to (MGD)2–Fe2+–NO. Statistical significance (using Student's t test): * P<0.05.

