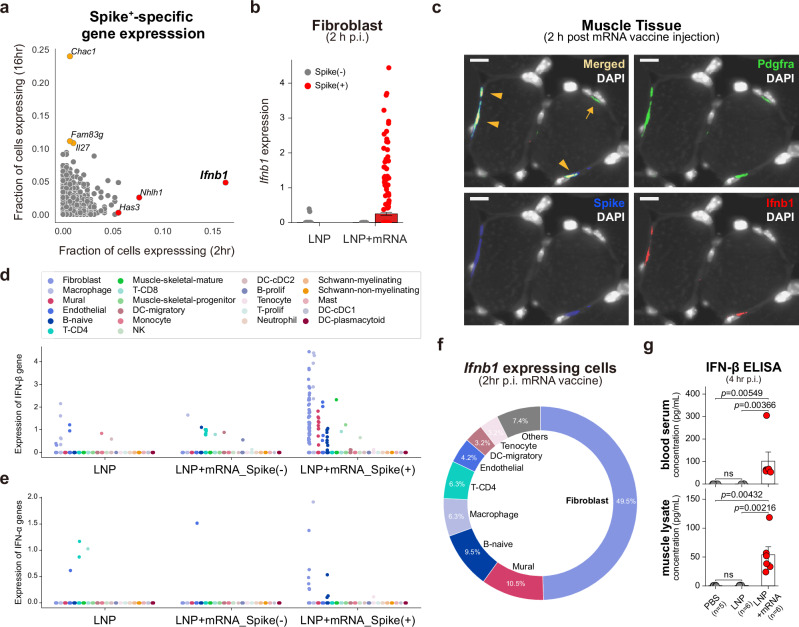
Fig. 4. mRNA-specific induction of IFN-β in injection-site fibroblasts.
a Expression profiles of spike- non-expressed genes in spike+ fibroblasts. Fibroblasts without spike mRNA transcripts from the injection-site scRNA-seq data were merged, and genes with an expressing cell ratio <0.01 were designated as the non-expressed genes in spike- fibroblasts. The expression profiles of the spike- non-expressed genes were evaluated in spike+ fibroblasts from either 2 h p.i. or 16 h p.i. samples of mRNA vaccine injection, and their expressing cell ratios are denoted on the x-axis (2 h p.i.) and the y-axis (16 h p.i.) of the scatter plot. b Ifnb1 expression (log-transformed) in each of the injection-site fibroblasts from 2 h p.i. samples of LNP or LNP+mRNA injection. Red indicates spike+ fibroblasts (n = 289 from LNP+mRNA injection), and gray dots represent spike- fibroblasts (n = 1601 from LNP injection, n = 43 from LNP + mRNA injection). Data are presented as mean values ±SEM. c Representative RNA-ISH image acquired from mRNA-vaccine 2 h p.i. muscle tissue. Images were selected from biological replicates of mRNA-vaccine injected samples (n = 4). Green, blue, and red indicate detection signals for Pdgfra, Spike, and Ifnb1 transcripts, respectively. Orange arrowheads indicate co-localization of the fluorescent signals, which implies spike+ fibroblasts expressing Ifnb1 transcripts, and the orange arrow indicates a spike- fibroblast not expressing Ifnb1 transcript. Scale bars indicate 10 µm. d, e Expression of (d) IFN-β transcripts (Ifnb1 gene) and (e) IFN-α transcripts (sum of the 14 IFN-α transcripts) in the injection-site scRNA-seq data from 2 h p.i. samples of LNP and LNP+mRNA. The 2 h p.i. injection site cells were split according to the treatment condition, detection of spike mRNA, and cell type identities. The y-axis represents log-transformed counts of the transcripts. f The fraction of cell types in the cells with Ifnb1 transcripts. g Measured levels of IFN-β in (top) blood and (bottom) muscle samples using ELISA. All the samples were collected 4 h after injections. Data are presented as mean values ±SEM. Statistical evaluations were conducted with two-tailed Mann–Whitney U tests (ns: nonsignificant).

