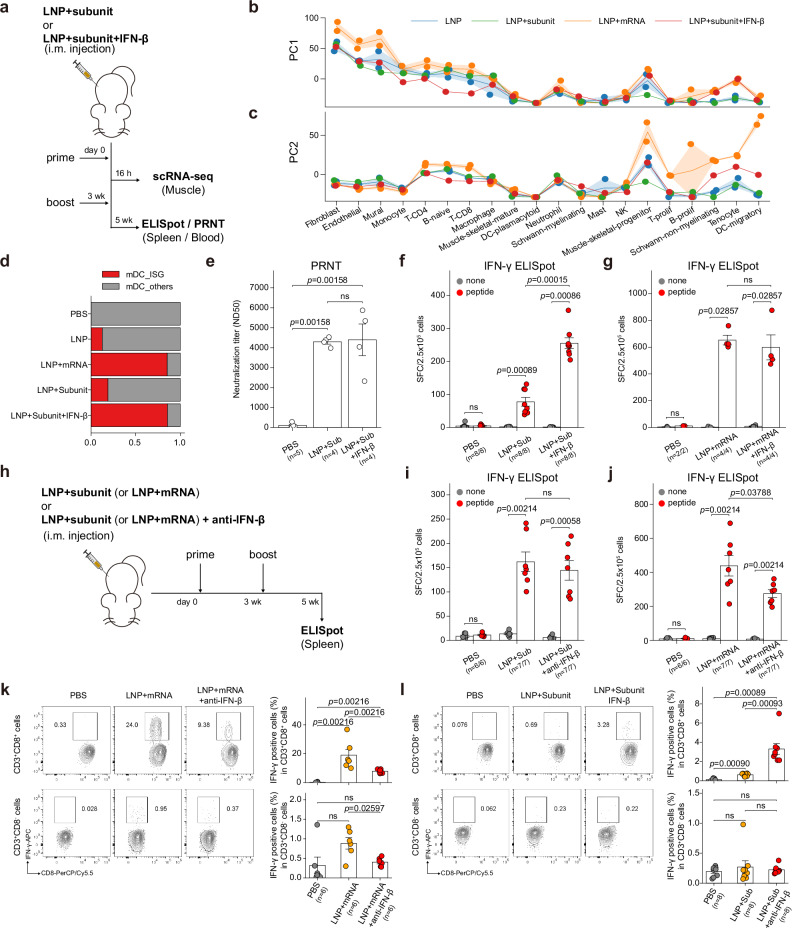
Fig. 6. Injection-site IFN-β guides cellular immune responses against mRNA vaccine.
a Experimental and sample preparation scheme: Mice were immunized with intramuscular injection of LNP+subunit or LNP+subunit+IFN-β. Two injections were given (prime and boost shot) with 3 weeks between shots. Injection-site muscles were resected 16 h after the prime shot, and spleen tissue for the ELISpot assay was sampled 2 weeks after the boost shot. b, c PC projections of the cell type–wise DEG vectors (vs PBS injection) of 16 h p.i. samples. (b) PC1 projections and (c) PC2 projections of the DEG vectors are plotted as line plots. Line plot indicates mean values, and the error bands indicate 95% confidence intervals. d Fraction of injection-site mDC clusters in each treatment condition. e PRNT assay conducted on mice intramuscularly injected with PBS, LNP+subunit, or LNP+subunit+IFN-β. Results from IFN-γ ELISpot assay. f, g Effects of IFN-β i.m. co-injection were evaluated in (f) LNP+subunit and (g) LNP+mRNA (mRNA vaccine) vaccination strategies. h Experimental scheme: Mice were immunized with intramuscular injection of LNP+subunit or LNP+mRNA, with or without anti-IFN-β blocking antibody. Shots were given twice and the spleen samples for ELISpot assay were collected 2 weeks after the boost shot. i, j Results from the IFN-γ ELISpot assay. Effects of IFN-β blocking antibody i.m. co-injection were evaluated in (i) LNP+subunit and (j) LNP+mRNA vaccination strategies. k, l Antigen-specific T cell responses at 35 days after vaccination as determined by flow cytometry analysis. Effects of (k) IFN-β blockade and (l) IFN-β addition are evaluated in (top panels) CD8+ and (bottom panels) CD8- T cells. All the data in bar plots are presented as mean values ±SEM. All statistical evaluations were conducted with two-tailed Mann–Whitney U tests (ns: nonsignificant). Schematic images were created with BioRender.com.

