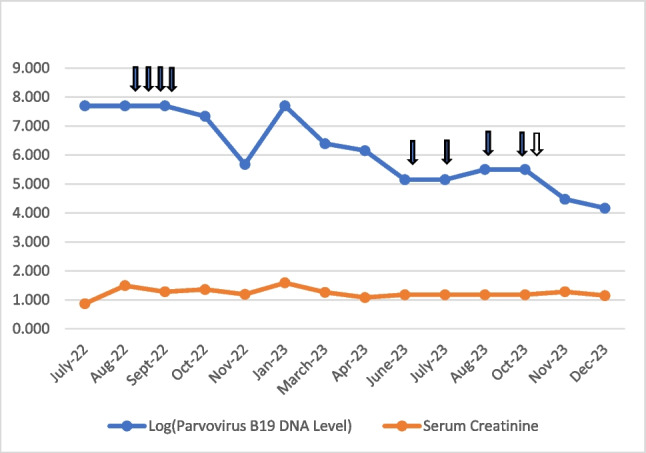
Fig. 1.

Illustration of a logarithmic graph capturing the temporal trends of log-transformed parvovirus B19 DNA levels, unaltered serum creatinine concentrations, the occurrence of intravenous immunoglobulin (IVIG) administration (denoted by black arrows), and the commencement of everolimus (indicated by a white arrow) spanning the timeline from July 2022 to December 2023. The figure provides a comprehensive visual depiction of the patient's therapeutic response, correlating variations in viral load with specific treatment milestones and immunosuppressive adjustments
