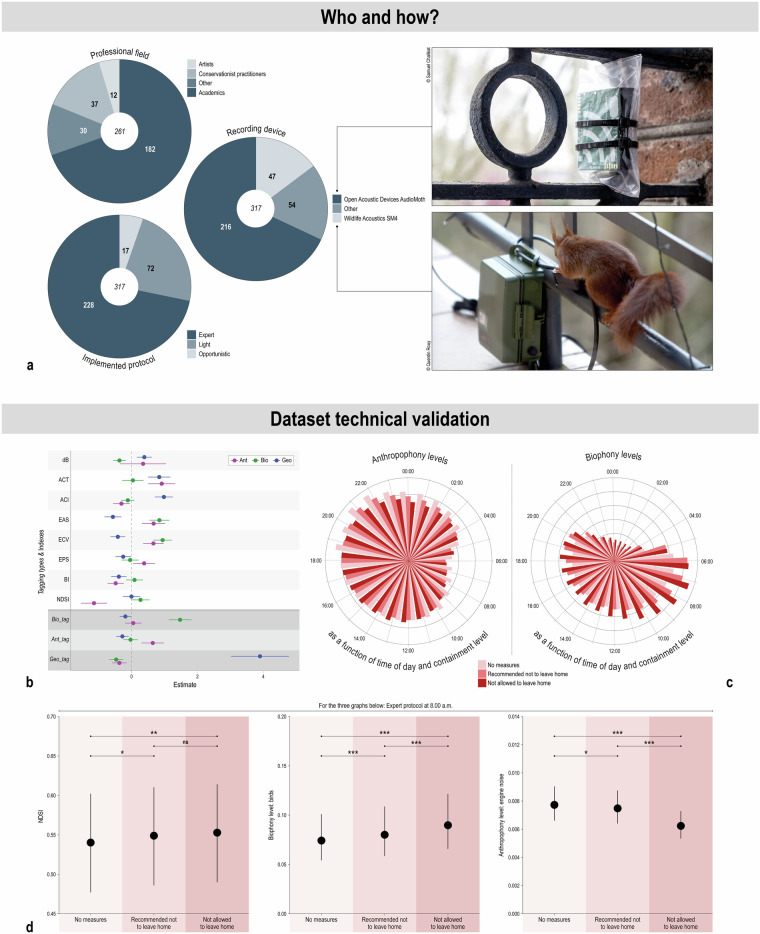
Fig. 2.
Panel a. Top left: Professional fields of the 261 participants. Middle: Distribution of type of devices for the 317 recording sites. Bottom left: type of protocol implemented. Right: Photos of the two main recording devices used: Open Acoustic Devices AudioMoth (top) and Wildlife Acoustics SM4 (bottom). Panel b. Association between the measured acoustic indices and tagging types and the presence of geophonical (Geo), biophonical (Bio) and anthropophonical (Ant) events detected manually by the contributors. Model estimates and associated 95% confidence intervals are represented with points and bars, respectively. Positive and negative estimates with confidence intervals not overlapping zero indicate positive and negative associations, respectively. Panel c. Radial barplots depicting the mean anthropophony and biophony level values per site, combining all protocols, recorded hourly throughout each period of COVID-19 containment levels. Panel d. Model predictions and associated 95% confidence intervals for NDSI, biophony (birds) and anthropophony (engine noise) levels at 8:00 a.m. during the COVID-19 confinement measures, following the expert protocol only. ***p < 0.001, **p < 0.010, *p < 0.050, ns: p > 0.050.

