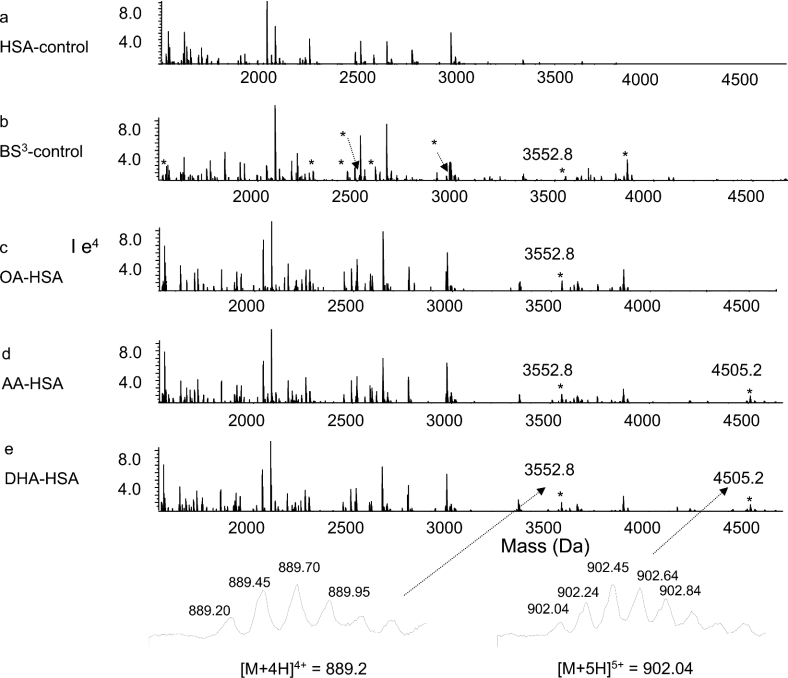
Figure 2. Nano-ESI-QqTOF reconstructed mass spectra of tryptic digests from unmodified (a), and BS3-modified control (b), OA-bound (c), AA-bound (d) and DHA-bound (e) HSA.
The peak with a mass of 3552.8 Da emerged from BS3-modified samples (b–e). The peak with a mass of 4505 Da emerged from AA- or DHA-bound HSA samples (d, e), but was absent from OA-bound HSA (c). Cross-linked peptides in the fatty acid-free control (b) are marked with an asterisk (*).

