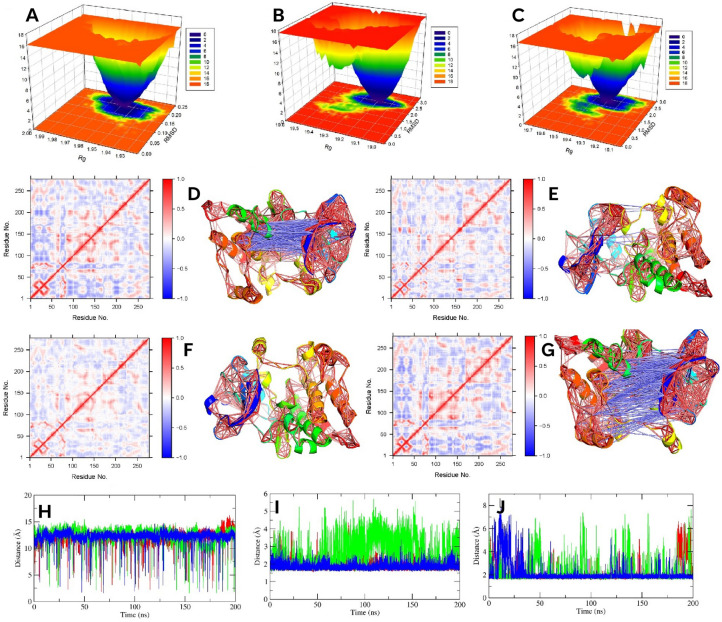
Figure 5.
The FEL plot of F (A), G (B), and control (C) bound protein. (D, E, F and G) denote 2D DCCM plot and 3D highly correlated (≥ ± 0.4) residues of apo, F, G, and control bound protein, respectively. (H, I, and J) denotes distance between 298–313, 298–407, and 313–412 resides, respectively. Green, blue, and red color represents F and G, and control, respectively.

