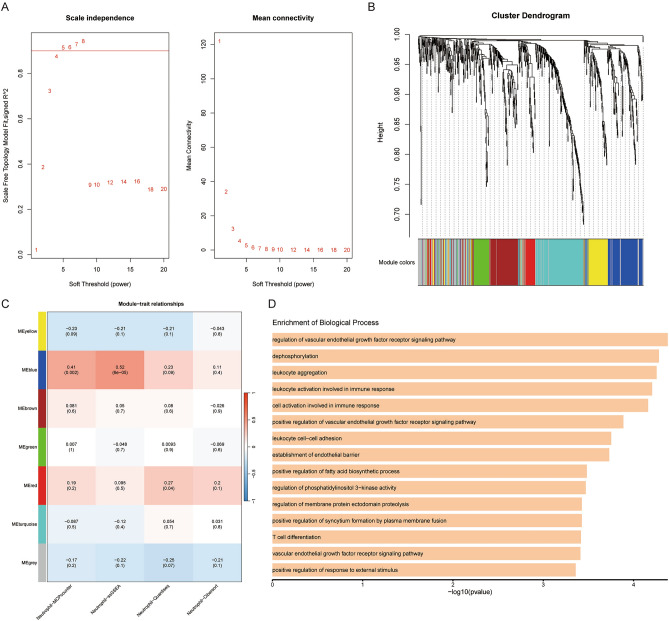
Figure 2.
Gene co-expression network analysis and identification of neutrophil- associated genes in CRSwNP. (A) Construction of the scale-first network with the soft threshold power β = 4. (B) Establishment of co-expressed gene modules based on dynamic hybrid cut method. (C) Correlations between module eigengene and neutrophil infiltration. The blue module (MEblue) indicates a positive relationship with the neutrophil infiltration level in CRSwNP. (D) Function enrichment of the 116 genes in the blue module (Software: R version 4.3.1. URL: http://www.R-project.org).

