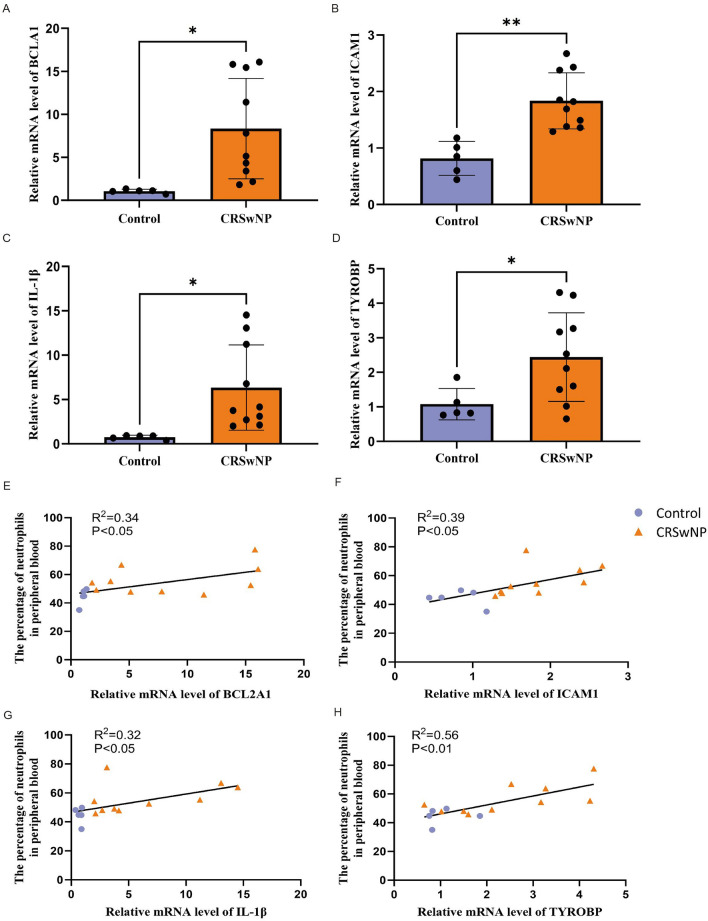
Figure 4.
The gene expression levels of hub genes and correlation with the proportion of neutrophils in CRSwNP and control samples. The mRNA relative expression levels of the BCL2A1 (A), ICAM1 (B), IL-1β (C) and TYROBP (D) in CRSwNP (n = 10) and control samples (n = 5) by RT-qPCR and statistical significance by Student’s t-test; Correlations of relative mRNA expression levels of BCL2A1 (E), ICAM1 (F), IL-1β (G) and TYROBP (H) with the percentage of neutrophils in peripheral blood by Pearson correlation analysis. *p < 0.05, **p < 0.01.

