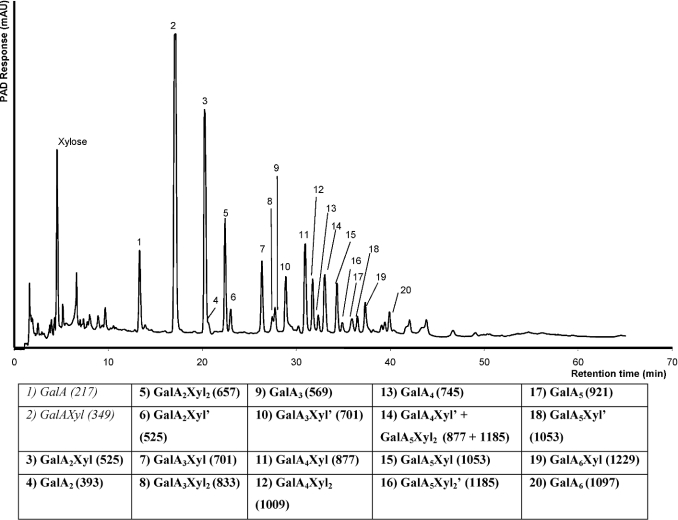
Figure 2. HPAEC elution profile of an XGA-29 digest.
The included table summarizes the newly identified XGA oligosaccharides (bold; see text for details). The m/z values of the XGA oligosaccharides (including the addition of an H+ and Na+) are shown in parentheses. The accentuated XGA oligosaccharides (′) are isomers with different distribution of xylose over the GalA backbone.

