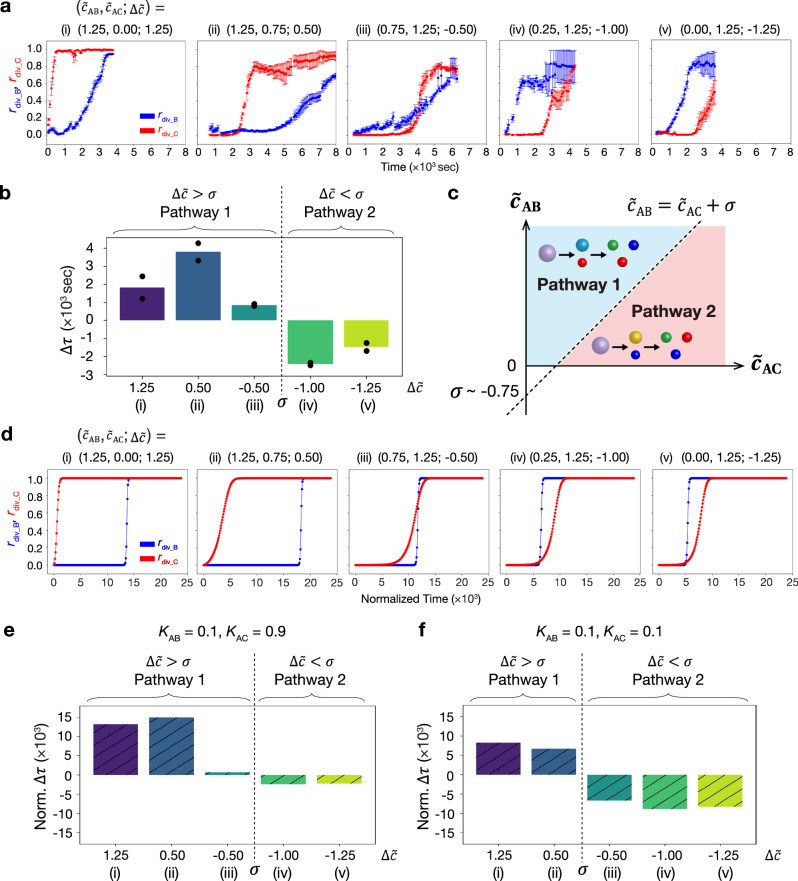
Fig. 7. Experimental and simulation results of molecular concentration comparator.
a Time courses of rdiv_B (blue) and rdiv_C (red) at varying the two normalized initial total concentrations of inhibitor RNAs and in the experiment. = and (i = 1, 2), where the input initial total RNA concentrations are defined as [miR-6875-5p], [miR-4634], and ; [miR-1246], [miR-1307-3p], and . The () was varied at (i) 1.25, (ii) 0.50, (iii) 0.50, (iv) 1.00, and (v) 1.25. RNase H concentration was fixed at 0.25 U/µL in all experiments. The plots in conditions (i) and (v) are identical to those in Figs. 5f and 5g, respectively. Data are presented as the mean ± SE of three field of view of microscopy observation. b Time difference Δτ at each of five RNA conditions (i)-(v) in the experiment. Data are presented as the mean; more than four field of view of microscopy observation in two independent experiments. c Schematic of the pathway selection depending on the , , and offset concentration in the experiment. was estimated as 0.75, which is the average of between conditions (iii) and (iv). d Time courses of rdiv_B (blue) and rdiv_C (red) at varying inhibitor RNA concentrations in the reaction-diffusion simulation. The was varied at (i) 1.25, (ii) 0.50, (iii) 0.50, (iv) 1.00, and (v) 1.25. The hybridization rate and the strand displacement rate between T†ABi and L†AB were set 10 times lower than those between T†ACi and L†AC, respectively. Threshold parameters KAB and KAC were set as 0.1 and 0.9, respectively. n = 16. e, f Time difference Δτ at each of five RNA conditions (i)–(v) in the reaction-diffusion simulation. The hybridization rate and the strand displacement rate between T†ABi and L†AB were set 10 times lower than those between T†ACi and L†AC, respectively. KAB = 0.1 and KAC = 0.9 (). n = 16 (e). The hybridization rate and the strand displacement rate between T†ABi and L†AB were the same as those between T†ACi and L†AC, respectively. KAB = 0.1 and KAC = 0.1 (). n = 16 (f). Source data are provided as a Source Data file.

