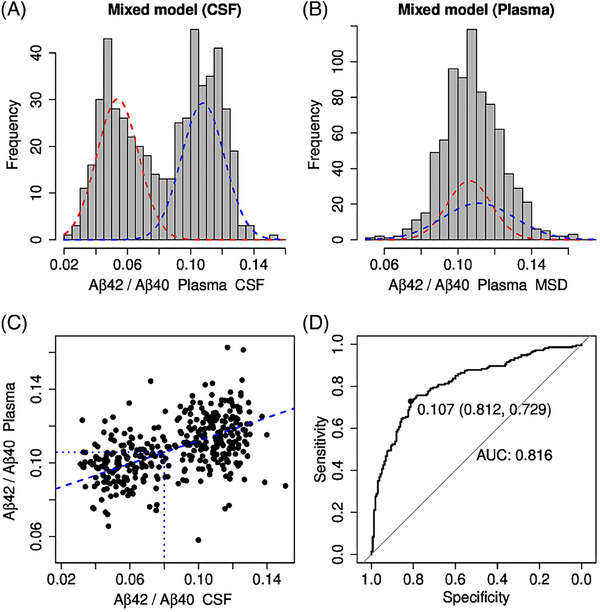
FIGURE 2.

Mixture modeling analysis of the Aβ42/Aβ40 ratio in plasma and CSF. Mixture modeling analysis revealed a typical bimodal distribution for CSF (A) but not Aβ42/Aβ40 in IP eluates from plasma (B). To determine the Aβ42/Aβ40 cutoff value in plasma, Aβ42/Aβ40 values in CSF were correlated with the corresponding Aβ42/Aβ40 values in plasma via a linear regression model (C). The intersection of the dashed blue lines indicates the 0.106 cutoff value for plasma Aβ42/Aβ40. In (D), the receiver‐operating characteristic (ROC) curve was plotted with an area under the curve (AUC) of 0.81 for Aβ42/Aβ40 to predict amyloid positivity based on Aβ42/Aβ 40 classification in CSF. Aβ42/Aβ40, amyloid beta X‐42/amyloid beta X‐40; CSF, cerebrospinal fluid.
