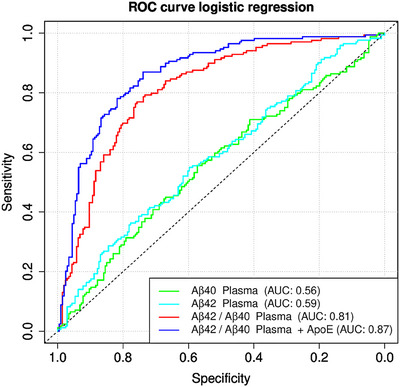
FIGURE 3.

Receiver‐operating characteristic curves for the Aβ40 and Aβ42, Aβ42/Aβ40 ratio, and Aβ42/Aβ40 ratio + APOE ε4 carriage. For the plasma Aβ42/Aβ40 ratio, we calculated a receiver‐operating characteristic (ROC) curve comparing amyloid‐positive against amyloid‐negative cases with an area under the curve (AUC) of 0.81. However, when stratified by APOE ε4 positivity, the AUC rose as high as 0.87, with a 0.73 corresponding specificity and 0.87 sensitivity. Significantly lower AUCs were found for Aβ40 at 0.56 and for Aβ42 plasma at 0.59. Aβ40, amyloid beta X‐40; Aβ42, amyloid beta X‐42; Aβ42/Aβ40, amyloid beta X‐42/amyloid beta X‐40 ratio; APOE ε4, apolipoprotein E ε4.
