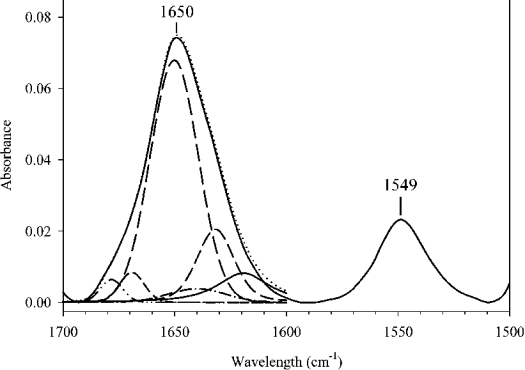
Figure 5. IR spectrum of DMPC–apoE CT domain discoidal complexes in the 1700–1500 cm−1 region (solid curve).
Secondary structure of DMPC–apoE CT domain complex was obtained by analysis of IR spectrum between 1700 and 1600 cm−1 by curve fitting. The different curves used to fit the amide I peak are displayed as broken lines.

