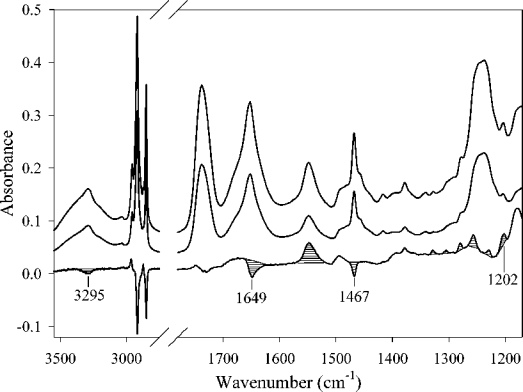
Figure 6. IR spectra of DMPC–apoE CT domain complexes.
The top spectrum was obtained with parallel polarized light and the middle spectrum with perpendicular polarized light. The bottom spectrum is the dichroic spectrum obtained by subtracting the middle spectrum (perpendicular polarization) from the top spectrum (parallel polarization). The optical density amplitude of the bottom spectrum has been increased three times with respect to the other spectra. Striped peaks are the most important for the orientation determination (see text).

