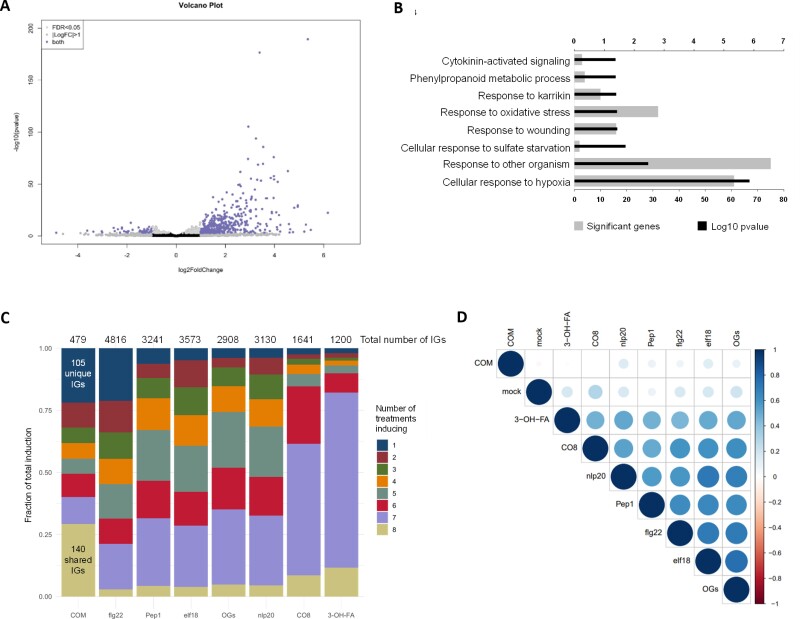
Fig. 4.
COM treatment induces a transcriptional reprogramming consistent with activation of PTI. (A) Volcano plot representing the statistically significant (adjusted P-value <0.05) differentially expressed genes (log2 fold change ≤ –1 or ≥1), in Arabidopsis Col-0 plants upon treatment with COM for 30 min (479 up-regulated genes and 49 down-regulated genes). (B) GO term enrichment analysis of the genes that showed up-regulation upon treatment with COM for 30 min. (C) Comparison of genes induced by treatment of COM with those induced by seven other elicitors of PTI. The total number of induced genes (IGs) for each elicitor (over all time points in Bjornson et al. 2021) is presented and the numbers of genes induced by all treatments or solely by COM are highlighted. (D) Correlation plot depicting changes in gene expression between all the elicitors evaluated in the comparative analysis: all transcriptomes compared at 30 min post-treatment.

