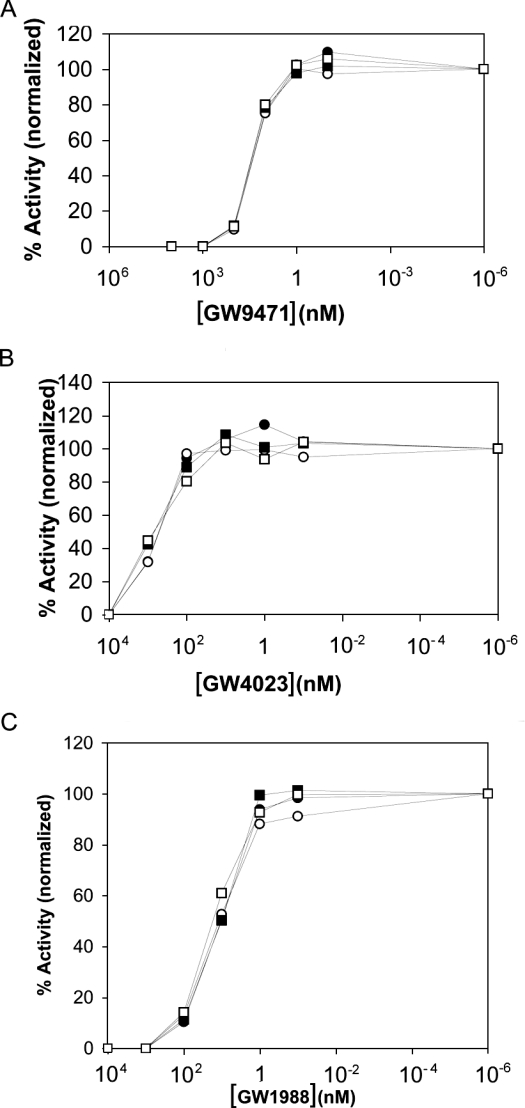
Figure 5. Effect of hydroxamic acid inhibitors on hTACE truncates and variants.
Assays were run using hR473 (●), hR473/C184A (○), hR651 (■) and hR651/C184A (□). Inhibitor curves are the averages of three or four replicate runs. The inhibitors were added at the start of the 1 h incubation: (A) GW9471, (B) GW4023 and (C) GW1988.

