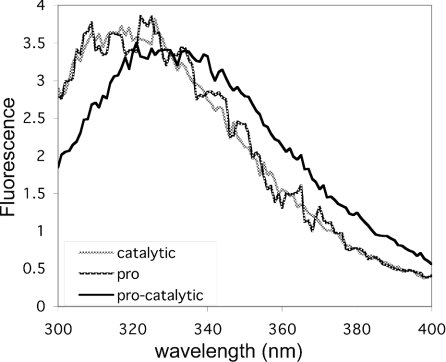
Figure 6. Fluorescence emission spectra of hTACE forms.
hTACE's catalytic domain, prodomain or the procatalytic domain zymogen complex isolated from cell culture media was diluted to a final concentration of 3 μM in 20 mM Tris/HCl (pH 8.0) containing 150 mM NaCl. The excitation wavelength was 290 nm and emission was recorded between 300 and 400 nm. Dark grey line, free prodomain; light grey line, free catalytic domain; black line, procatalytic domain complex. The background-subtracted fluorescence intensity is shown in arbitrary units.

