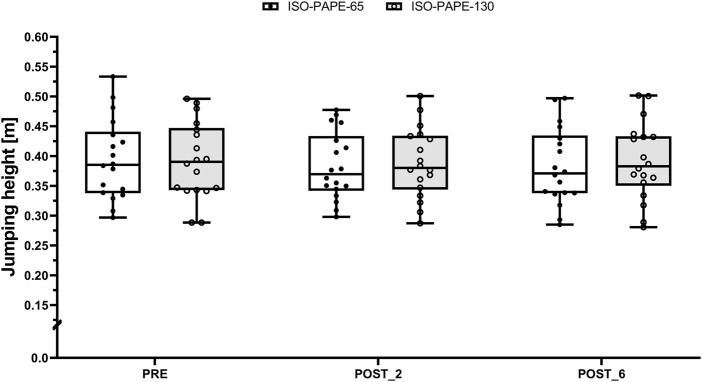
FIGURE 1.
Boxplot (Q1 to Q3, including Median), and Whiskers (showing minimum and maximum values) for Counter-Movement-Jumping height after the general warm-up (PRE) as well as 2 (POST_2) and 6 min (POST_6) after the respective PAPE protocols with an additional load of 65% of one repetition maximum (ISO-PAPE-65; white box) and 130% of one repetition maximum (ISO-PAPE-130; grey box). Individual values are also depicted (black circles for ISO-PAPE-65 and white circles for ISO-PAPE-130).

