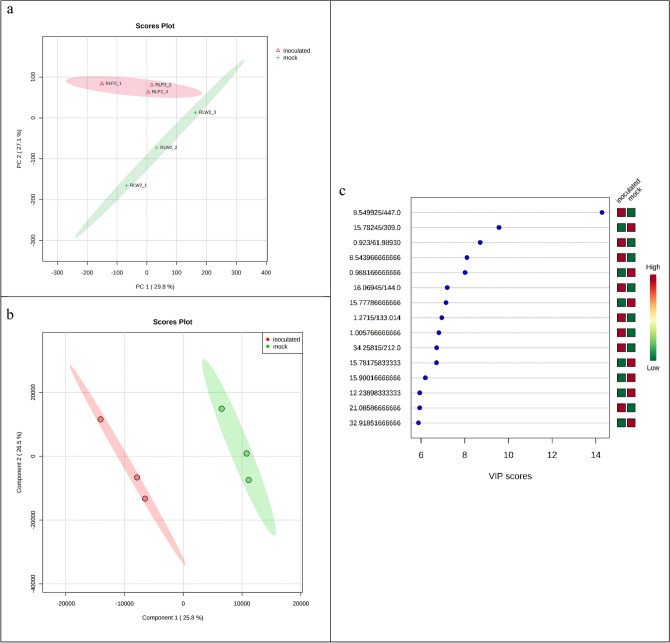
Figure 2.
PCA and PLS-DA analysis; (a) Principal component analysis PCA score plot showing distinct relationship between samples and differences in resistant cultivar inoculated with the pathogen LM (RP) vs resistant cultivar with mock inoculation (RM) at 48 hpi/21 °C in negative ionization mode with the MetaboAnalystR 6.0 software package along the x-axis (PC1) and within groups along the y-axis (PC2). PC1 and PC2 respectively summarize 29.8% and 27.1% of the observed variance in the metabolites, green and red shaded areas are the 95% confidence regions of each group; (b) Scores plot of metabolite features in PLS-DA (partial least squares-discriminant analysis) model representing covariance between component 1 (25.8%) at x-axis and component 2 (26.5%) at y-axis; (c) Variable of Importance in Projection (VIP) score plots derived from PLS-DA analysis, a higher VIP score (> 2.0) for metabolites represent higher contribution in the PLS-DA model.

