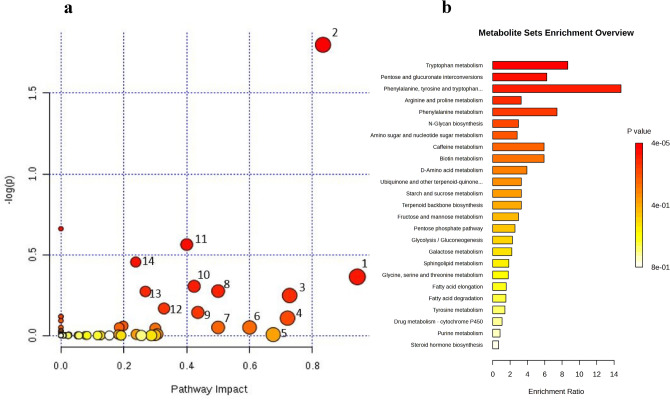
Figure 7.
Overview of pathways in Brassica napus–Leptosphaeria maculans pathosystem. (a) Metabolic pathway analysis (MetPA) from negative ionization mode with the MetaboAnalystR 6.0 software package. All the matched pathways are displayed as circles. The color and size of each circle are based on p-value (darker colors indicate more significant changes of metabolites in the corresponding pathway) and pathway impact value (the larger the value, the more impact), respectively. The most impacted pathways are annotated. 1: Alanine, aspartate, and glutamate metabolism, 2: Phenylalanine metabolism, 3: Tyrosine metabolism, 4: Tryptophan metabolism, 5: alpha-Linolenic acid metabolism, 6: Riboflavin metabolism, 7: Isoquinoline alkaloid biosynthesis, 8: Stilbenoid, diarylheptanoid, and gingerol biosynthesis, 9: Glyoxylate and dicarboxylate metabolism, 10: Citrate cycle (TCA cycle), 11: Indole alkaloid biosynthesis, 12: Phenylpropanoid biosynthesis, 13: Porphyrin and chlorophyll metabolism, 14: Pantothenate and CoA biosynthesis. (b) Metabolite sets enrichment overview. The horizontal bar (white-to-red) reflects increasing statistical significance.

