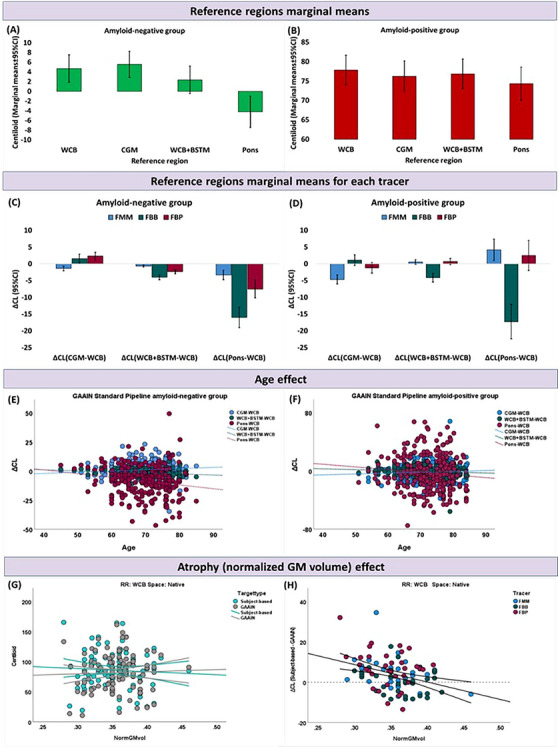
FIGURE 1.

The marginal means of Centiloid (CL) values for each reference region for amyloid‐negative (A) and amyloid‐positive (B) group. C and D show the difference in marginal means for each Reference Region (RR) versus Whole Cerebellum (WCB) per tracers for amyloid‐negative and amyloid‐positive groups, respectively. Differences in the CL between WCB and Cerebellar Gray Matter (CGM), Whole Cerebellum plus Brainstem (WCB+BSTM), and pons as a function of age for amyloid‐negative and amyloid‐positive groups, respectively (E, F). G shows CL (95% CI) values extracted from two different pipelines using predefined GAAIN cortical target ROI and subject‐based cortical target Region of Interest (ROI). (H) Scatter plot showing the differences (95% CI) in the calculated CL when using subject‐based cortical target versus predefined GAAIN cortical target ROI as a function of global brain atrophy (normalized gray matter volume) for participants diagnosed with dementia, and with positive amyloid status. CGM, cerebellum gray matter; CL, Centiloid; FBB, 18F‐Florbetaben; FBP, 18F‐Florbetapir; FMM, 18F‐Flutemetamol; ROI, region of interest; RR, reference region; WCB, whole cerebellum; WCB+BSTM, whole cerebellum plus brainstem.
