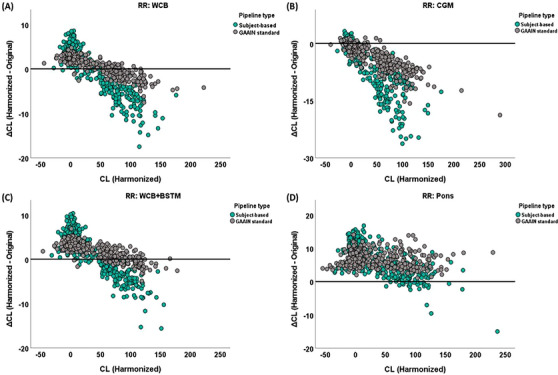
FIGURE 2.

Bland–Altman plots show the difference in the measured Centiloid (CL) between harmonized and original positron emission tomography (PET) images when using (A) whole cerebellum (WCB); (B) cerebellum gray matter (CGM); (C) whole cerebellum plus brainstem (WCB+BSTM); and (D) pons as reference region. It should be noted that all CL values were calculated using predefined GAAIN reference regions and GAAIN cortical target, in MNI space. All graphs include two pipeline types. Gray circles present GAAIN standard pipeline when predefined GAAIN RRs and cortical target ROI are used, and quantification has been done in MNI space. Green circles represent subject‐based pipelines, which have been defined based on subject‐based reference regions and cortical target ROI, in native space. ROI, region of interest; RR, reference region.
