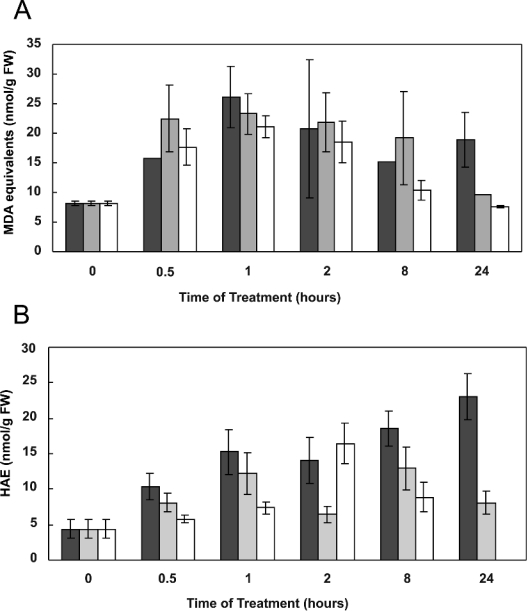
Figure 5. Measurement of lipid peroxidation products as (A) MDA equivalents or (B) HAE in Arabidopsis cell cultures.
Cells were treated with 400 μM menadione (black), 25 μM antimycin A (grey) or 88 mM H2O2 (white). MDA equivalents and HAE in 5-ml samples of cells were determined using the TBARS and HAE assay at specified times after treatment. Each time point represents the mean±S.E.M. for three separate cultures. FW, fresh weight.

