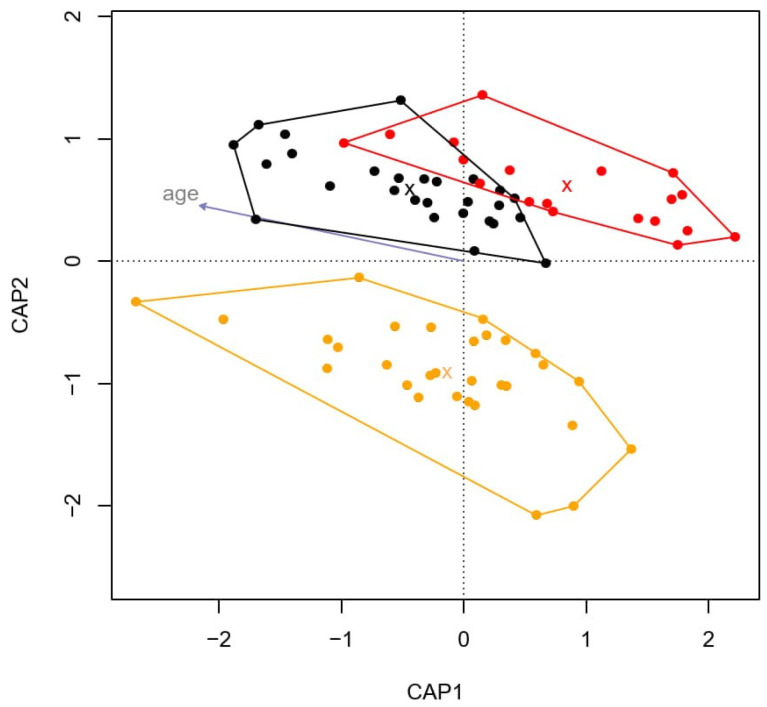
Figure 1.
Distance-based redundancy analysis grouped healthy and IBD horses into distinct clusters. Black circles represent samples of healthy horses, orange circles represent survey IBD horses, and red circles represent acute IBD horses. Group averages are marked with X and the clusters are defined based on the outermost values among each study group. Additionally, the individual eigenvalues of the individuals are correlated with the age of the horse (gray arrow).

