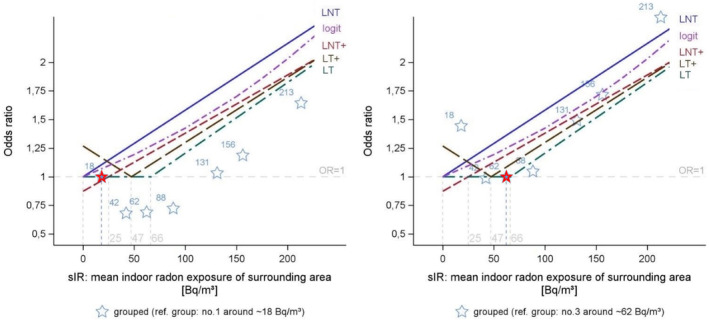
FIGURE 1.

Fit of parametric models. Stars indicate the point estimates of ORs adjusted for study site, sex, age, and smoking (type: Never, former, and current smoker; age at smoking initiation; time since smoking cessation; pack years) by exposure group, the mean sIR is given (see Table 2); the reference exposure class is printed in red (therefore OR = 1). Left panel: Adjusted ORs for exposure groups with reference category “4–<25 Bq/m3”; right panel: Adjusted ORs for exposure groups with reference category “50–<75 Bq/m3”; LNT linear non‐threshold model; LNT+ linear shifted non‐threshold model; LT linear threshold model; LT+ linear mirror point model; logit logistic regression model.
