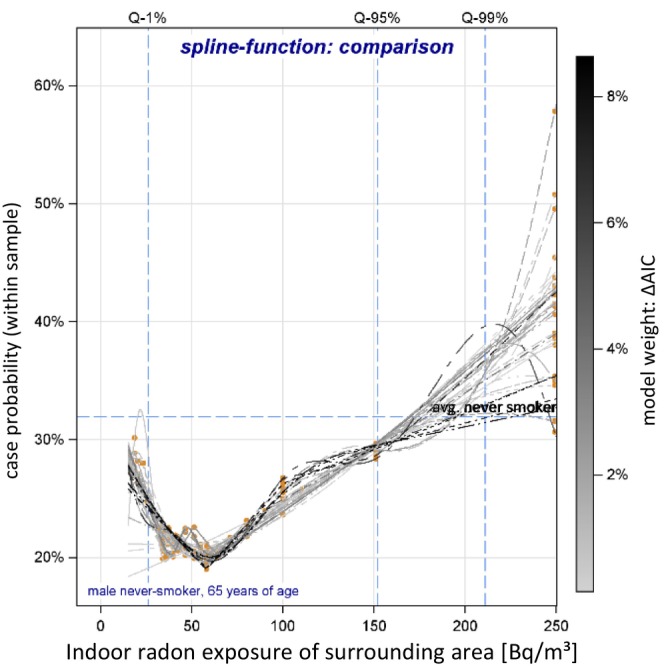
FIGURE 2.

Estimated spline function for the case‐probability (ΔAIC‐ weighted): Overall LC. Spline functions (gray to black lines) are highlighted according to the goodness of model fit measured as ΔAIC, relative to the based model (used as model weights for model averaging); radon exposure: Q‐1%: 1%quantile = 30 Bq/m3, Q‐95%: 95% quantile = 152 Bq/m3, and Q‐99%: 99%‐quantile = 207 Bq/m3.
