Figure 1.
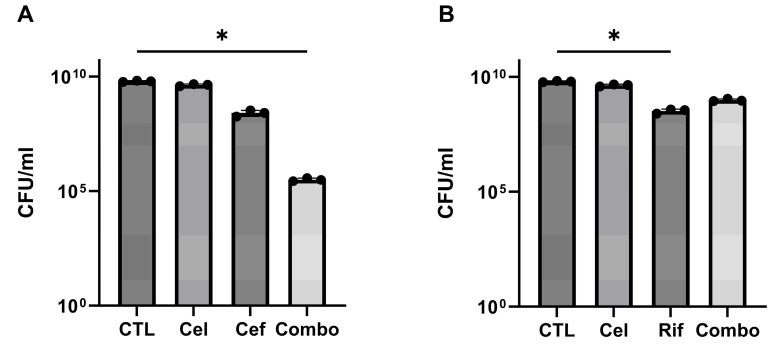
In vitro antimicrobial activity of (A) cefazolin 0.3 µg/mL (1×MIC) and celecoxib 250 µg/mL alone or in combination and (B) rifampicin 0.2 µg/mL (1×MIC) and celecoxib 250 µg/mL alone or in combination. Each bar plot represents the average of three independent experiments with three replicates per experiment. A one-way ANOVA with Tukey’s post hoc test was performed to determine significant differences between the groups. Standard deviation and significance level are shown. * p < 0.05.

