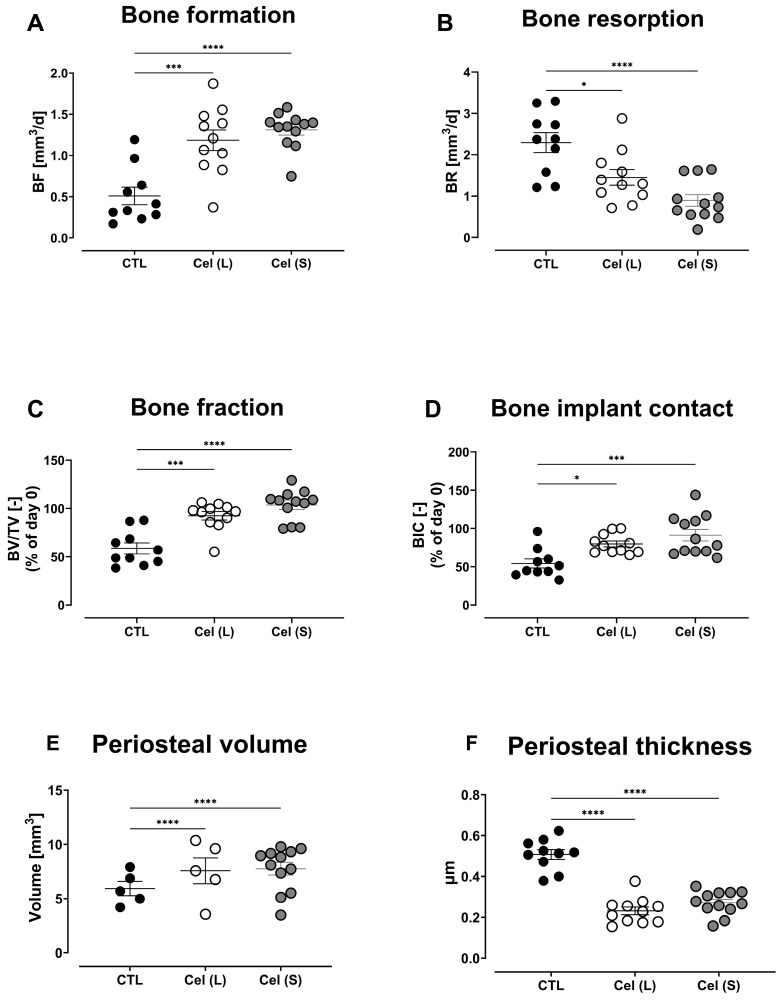
Figure 3.
Bone changes in the control (CTL), long-term celecoxib (Cel(L)), and short-term celecoxib (Cel(S)) treatment groups of an S. epidermidis infection. Differences in day 6 bone formation (A), bone resorption (B), bone fraction (C), and bone–implant contact (D). Day 14 periosteal reaction is shown as the periosteal volume (E) and periosteal thickness (F). Data shown are the mean ± SEM. A two-way ANOVA with Dunnett’s post hoc test was performed to determine significant differences between treatment groups and the control group. * p < 0.05, *** p < 0.001, **** p < 0.0001.

