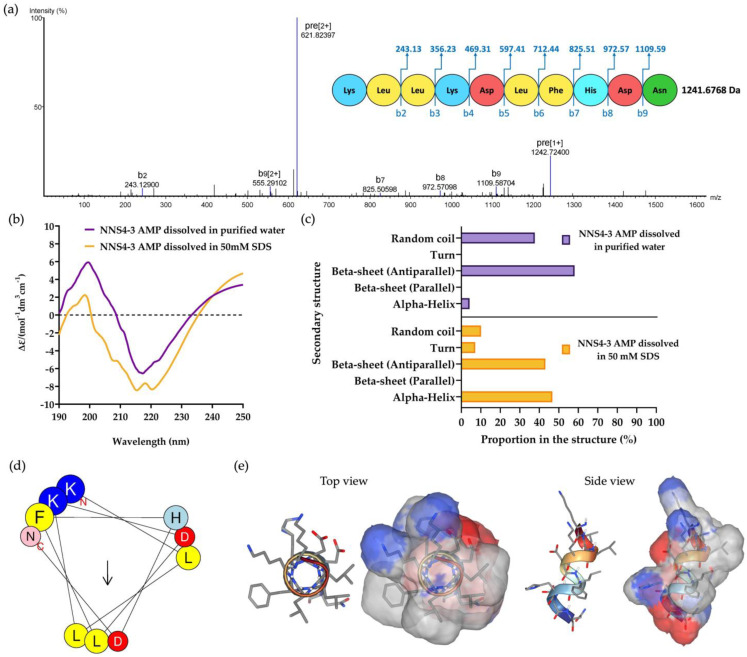
Figure 3.
The mass spectrum of NNS4-3 AMP showed amino acid sequence by de novo sequencing with b-ion and mass detection with positive mode (a). The secondary structure of the determined amino acid sequence was analyzed by CD spectroscopy. The CD spectrum from 190 to 250 nm was observed when NNS4-3 AMP was dissolved in purified water or 50 mM SDS solution (b). The determination of AMP secondary structure components using CD spectra was analyzed by the BeStSel method via a web-based service (c). The amino acid arrangement of an alpha-helix structure of the peptide was predicted by HELIQUEST (the arrow indicates the hydrophobic face of the peptide) (d). The 3D model with the molecular surface was predicted using the web-based structure prediction from PEP-FOLD4. The top view and side view display the molecular surface area with the positive electrostatic potential area (indicated in blue), negative electrostatic potential area (indicated in red), and hydrophobic area (indicated in grey) (e).

