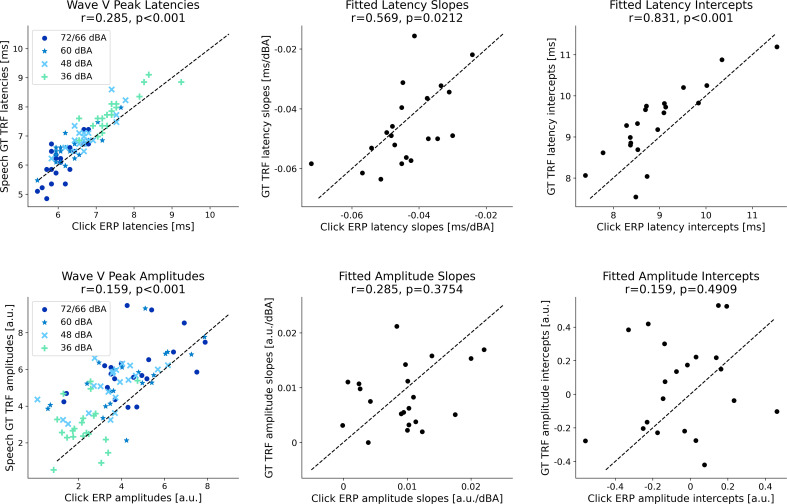
Figure 3.
Individual click ERP and speech GT TRF wave V peak amplitudes and latencies. Scatterplots with the individual wave V peak latencies (top row) and amplitudes (bottom row) are shown. Click ERPs are shown on the x-axis and GT TRFs on the y-axis. The leftmost column shows the data for all four intensity levels (different marker types are used for each level). The click ERPs and speech TRFs are significantly correlated (Pearson correlations and Holm–Sidak corrected p-values are shown in the subplot titles). Next, linear regression lines were fit using the latency/amplitude versus intensity level data for each participant. The middle column shows the slopes of the regression fits for each participant, and the right column shows the intercepts. The fitted latency slopes and intercepts are significantly correlated across click ERPs and GT TRFs, while the fitted amplitude slopes and intercepts are not (although a weak trend can be observed). These results indicate that the level-dependent changes are somewhat consistent across click ERPs and speech TRFs at a single participant level.

