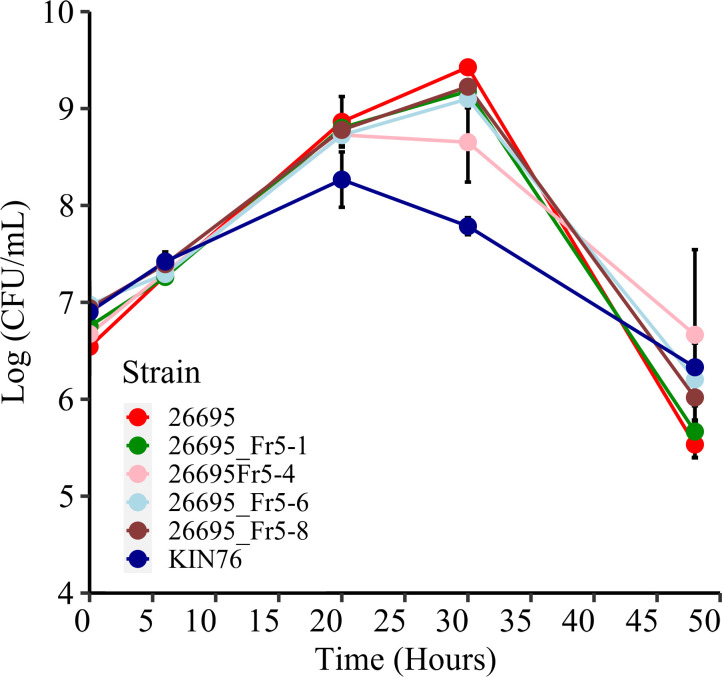
Fig 3.
Growth rate of WT and Fr5 mutant strains. This figure depicts the growth rates of the WT strain KIN76 and the AMX-R mutant strains 26695_Fr5-1, 26695_Fr5-4, 26695_Fr5-6, and 26695_Fr5-8 compared to the susceptible strain 26695. Colony-forming units (CFUs) were counted at 0, 6, 20, 30, 48, and 72 hours post-inoculation. The results are presented as the means and standard errors of four independent experiments. The mutant strains did not exhibit a significant difference from the WT 26695, whereas the growth rate of strain KIN76 showed a significant difference compared to 26695 by the Wilcoxon signed-rank test (P = 0.0264).

