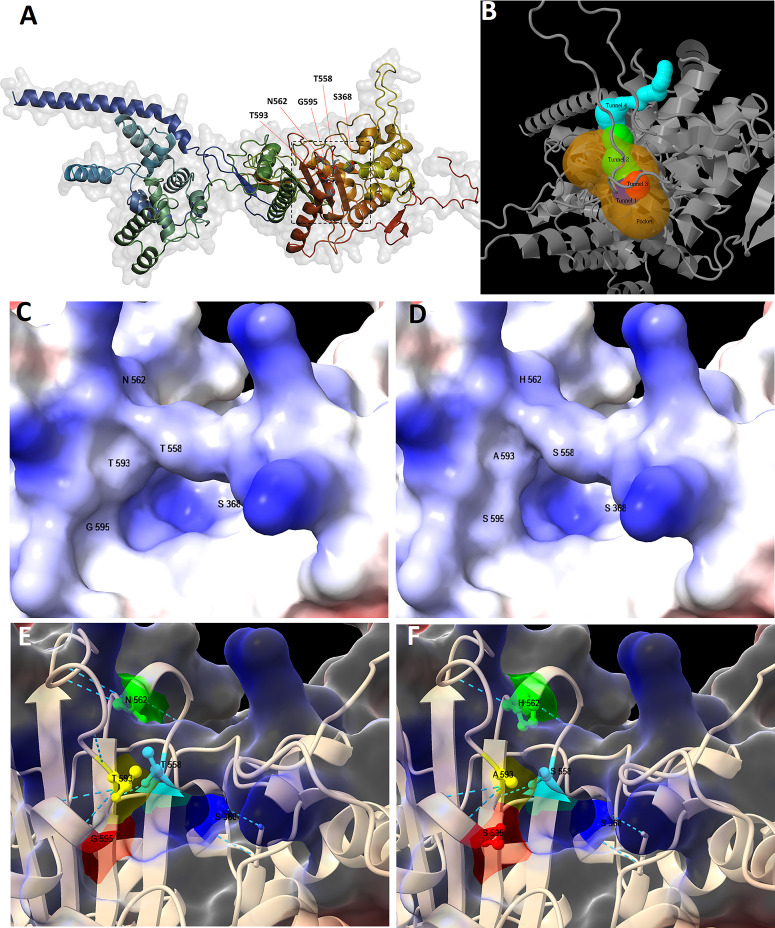
Fig 5.
H. pylori PBP1A tertiary structure models. Whole structure of PBP1A of strain 26695, modeled through Alfafold2Colab and visualized using PyMol (A); the square roughly indicates the pocket, and the red arrows indicate residues at positions 368, 558, 562, 593, and 595. The pocket with the highest relevance score, centered around catalytic residue S368 (hidden in the figure), and the corresponding tunnels as predicted by Caver (B). Closed-up structures of PBP1A near the catalytic residue were visualized without mutation (C, E) and with four mutations (D, F) using CSF-Chimera. In surface models (C, D), regions of positive charge are shaded blue (basic), and those of negative charge are shaded red (acidic). In ribbon models (E, F), residues in positions 558 (light green), 562 (orange yellow), 593 (orange), and 595 (red) are shown to line to the access route to catalytic residue S368 (blue). The narrow green line traces the approximate contour of the residues, and dotted lines correspond to hydrogen bonds.

