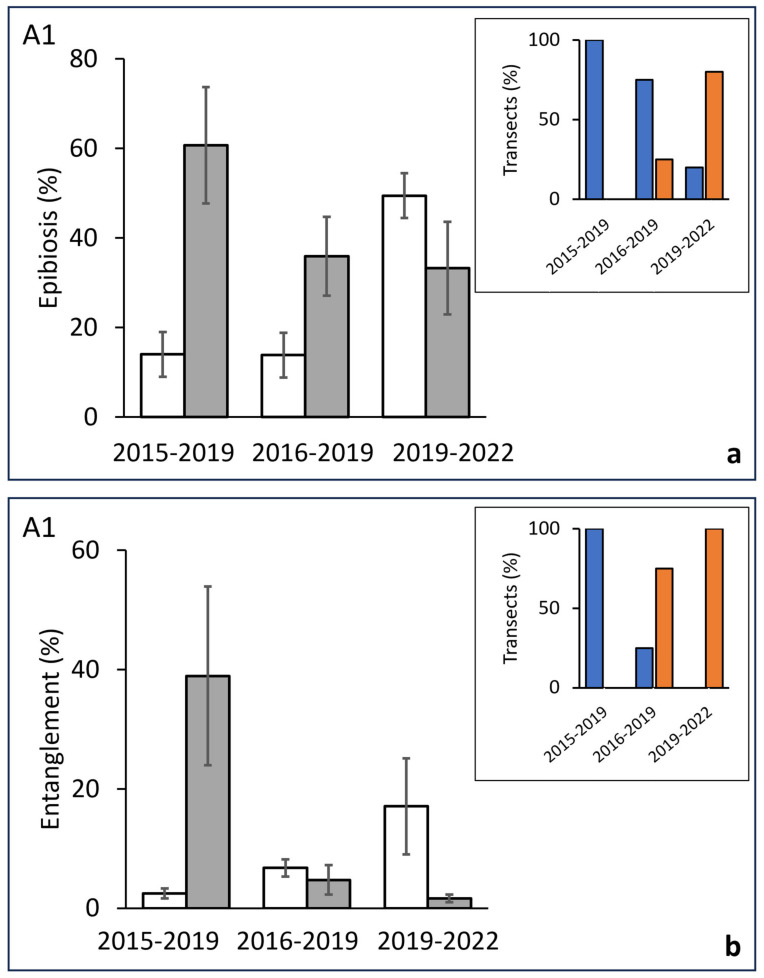
Figure 6.
Eastern area (A1). (a) Differences across time of the percent of epibionted colonies (before, white bars/after, grey bars) in the same groups of transects replicated after 3–4 years. Inset: percentage of transects showing a positive (blue bars) or negative (orange bars) variation in the value of affected colonies in each considered period. (b) Differences across time (before, white bars/after, grey bars) of the percent of entangle colonies in the same groups of transects replicated after 3–4 years. Inset: percentage of transects showing a positive (blue bars) or negative (orange bars) variation in the value of entangled colonies in each considered period.

