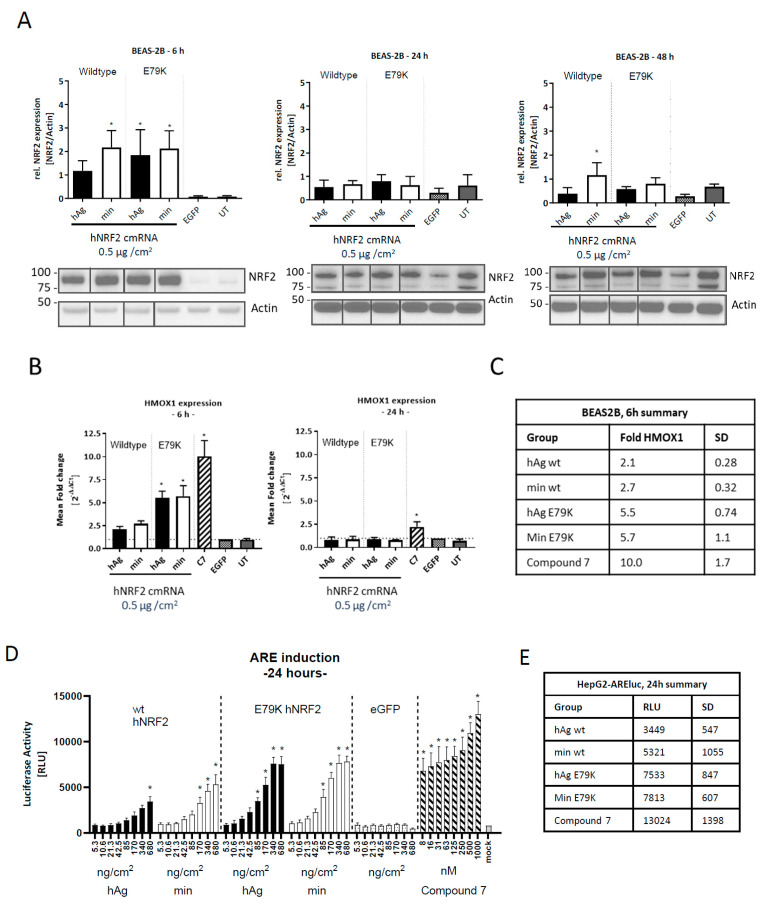
Figure 2.
Functional NRF2 expression from hNRF2 cmRNA in human cell lines. (A) NRF2 protein expression following transfection of hNRF2 cmRNAs in BEAS-2B cells. The full Western blot images were cropped to the relevant NRF2 band. (B) HMOX1 gene expression following transfection of hNRF2 cmRNAs in BEAS-2B cells. Data are pooled results from 3 independent experiments showing mean ± SD. * p < 0.05; ordinary one-way ANOVA with Dunnett’s multiple comparisons against eGFP-transfected control at each timepoint. (C) Table detailing mean values from (B) and SD. (D) ARE-luciferase values 24 h after transfection of hNRF2 cmRNAs in ARE-luc HepG2 cells. * p < 0.05; ordinary one-way ANOVA with Dunnett’s multiple comparisons against 5.3 ng/cm2 eGFP-transfected control. (E) Table detailing mean maximum luciferase signal for each treatment group in (D) and SD.

