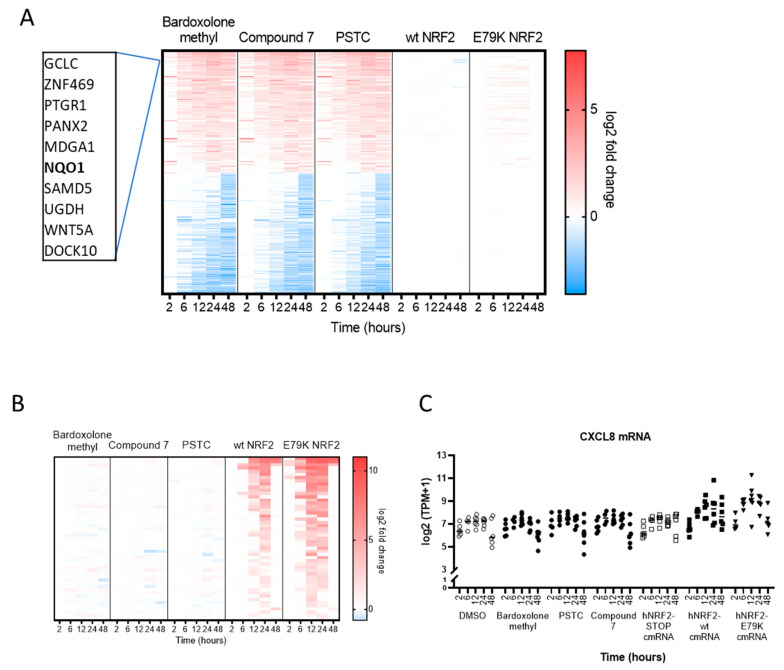
Figure 4.
Gene signature from HBECs selected for additional profiling: (A) Heatmap of the protein-coding transcripts that are significantly regulated by small molecules and not significantly regulated by either hNRF2 cmRNA treatment group at any timepoint. (B) Heatmap of the protein-coding transcripts that are significantly regulated by hNRF2 cmRNAs and not significantly regulated by any small molecules at any timepoints. Significance measured as log2 fold-change >1 or <−1 and q < 0.05 for n = 4–6 donors. (C) Transcript per million (TPM) expression data for CXCL8. (D) heatmap of the genes selected for additional profiling.


