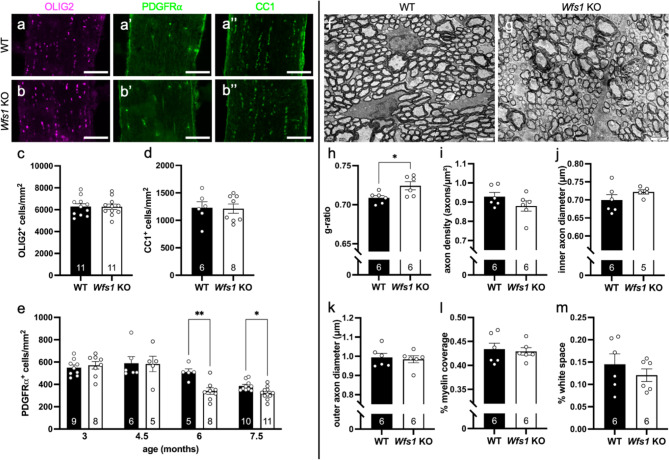
Fig. 3.
A reduction in the number of OPCs and minor myelin defects in the Wfs1 KO optic nerve. a-e Immunohistological stainings with different oligodendroglia lineage markers of WT (a) and Wfs1 KO optic nerves (b) show equal cell numbers of OLIG2+ oligodendroglial lineage cells (unpaired t-test, t20 = 0.05208) (c), and CC1+ mature oligodendrocytes (unpaired t-test, t12 = 0.1220) (d); but a reduced number of PDGFRa+ OPCs in Wfs1 KO optic nerves compared to WT at 6 and 7.5 months of age (e). Mixed-effects analysis with Sidak’s multiple comparisons; F1,54=5.512 and p = 0.0226 for genotype, F2,27=25.49 and p < 0.0001 for age; with p = 0.0092 for WT versus Wfs1 KO at 6 months and p = 0.0317 for WT versus Wfs1 KO at 7.5 months. f-m Transmission electron microscopy study of the optic nerve of 7.5-month-old WT (f) and Wfs1 KO (g) mice reveals a difference between genotype for g-ratio (unpaired t-test, t2.6=10, p = 0.0258) (h), but not for axon density (unpaired t-test, t1.4=10) (i), inner axon diameter (unpaired t-test, t1.3=9) (j), outer axon diameter (unpaired t-test, t0.3=10) (k), myelin area (unpaired t-test, t0.3=10) (l) or empty space in between axons (unpaired t-test, t0.9=10) (m). Scale bar 100 μm (a-b), 2 μm (f-g). Data presented as mean ± SEM, number of animals (N) depicted in the bar graphs

