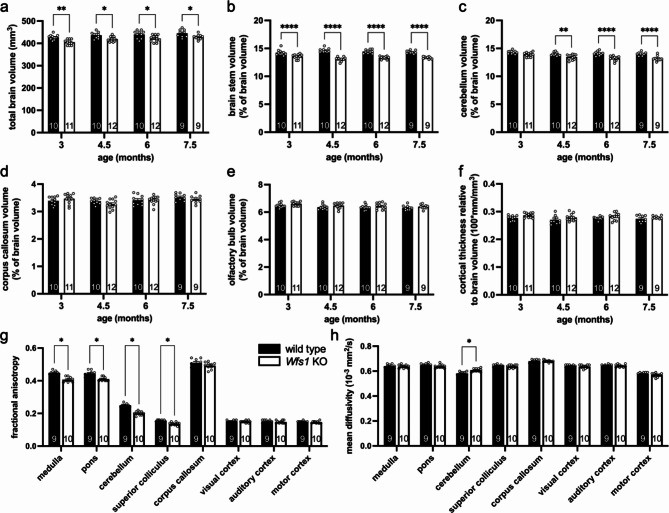
Fig. 4.
White and grey matter loss in the brain of Wfs1 KO mice. Structural MRI and diffusion tensor imaging study of Wfs1 KO versus WT mice from age 3 till 7.5 months. a Total brain volume is reduced in Wfs1 KO mice of all ages. Two-way ANOVA with Sidak’s multiple comparisons; F1,75=37.23 and p < 0.0001 for genotype, F3,75=7.709 and p = 0.0001 for age, with p = 0.0015 for 3 months, p = 0.0217 for 4.5 months, p = 0.0108 for 6 months, p = 0.0490 for 7.5 months. b Brain stem volume of Wfs1 KO animals is also reduced at all ages. Two-way ANOVA with Sidak’s multiple comparisons; F1,75=203.2 and p < 0.0001 for genotype, F3,75=0.09256 for age, with p < 0.0001 Wfs1 KO versus WT at all ages. c The volume of the cerebellum is smaller in Wfs1 KO mice starting from 4.5 months. Two-way ANOVA with Sidak’s multiple comparisons; F1,75=59.87 and p < 0.0001 for genotype, F3,75=6.754 and p = 0.0004 for age, with p = 0.0570 for 3 months, p = 0.0085 for 4.5 months, and p < 0.0001 for 6 and 7.5 months. d, f The volume of the corpus callosum (d), olfactory bulb (e), and the thickness of the cortex (f) is similar between genotypes. Two-way ANOVA with Sidak’s multiple comparisons; F1,75=0.5229 for genotype, F3,75=3.910 and p = 0.0119 for age, for corpus callosum; F1,75=6.116 and p = 0.0157 for genotype, F3,75=4.160 and p = 0.0088 for age, for olfactory bulb; F1,75=9.389 and p = 0.0030 for genotype, F3,75=1.812 for age, for cortical thickness. g Fractional anisotropy, studied in 7.5-month-old Wfs1 KO and WT mice, is different between genotypes for medulla (t17 = 6.753, p = 0.000024), pons (t17 = 5.000, p = 0.000548), cerebellum (t17 = 9.618, p < 0.000001) and superior colliculus (t17 = 5.183, p = 0.000449), but not for corpus callosum (t17 = 1.705), visual cortex (t17 = 0.7255), auditory cortex (t17 = 0.7334) nor motor cortex (t17 = 0.9602). Multiple unpaired t-tests. h Mean diffusivity studied in 7.5-month-old Wfs1 KO and WT mice, is different between genotypes only for cerebellum (t17 = 4.144, p < 0.005416). Multiple unpaired t-tests. Data presented as mean ± SEM, number of animals (N) depicted in the bar graphs

