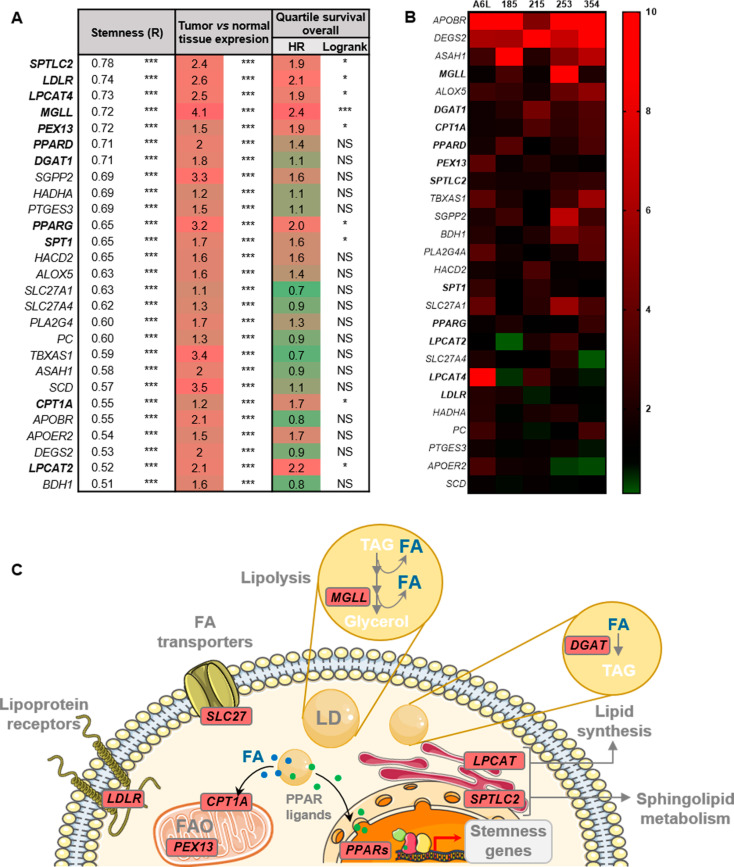
Fig. 1.
Lipid metabolism genes correlate with stemness in PDAC. (A) Bioinformatics analyses of lipid metabolism genes in human data included in the TCGA and GTEx project databases, were carried out with the webserver GEPIA2 (http://gepia2.cancer-pku.cn/). The genes were sorted by their correlation (R, first column) with a stemness signature composed of the genes NANOG, KLF4, OCT3/4 and SOX2. Data relative to expression in tumor vs. normal tissue and overall survival in the highest and lowest expression quartiles for each gene are shown in the second and third columns, respectively. (B) Heatmap of lipid metabolism genes overexpressed in PaCSC-enriched cultures (spheres) from five PDAC PDXs (A6L, 185, 215, 253, 354), evaluated by RTqPCR. In bold, genes determined in A with R > 0.7 or significantly correlated with poor survival. (C) Schematic representation of the main genes and pathways correlated with stemness in PDAC. Genes indicated in bold in A and B are highlighted in red in the drawing, indicating their corresponding pathways. FA: Fatty acid; LD: Lipid droplets; TAG: Triglycerides. The data are presented as the mean ± SEM of at least three independent experiments. * p < 0.05; *** p < 0.001

