Fig. 3.
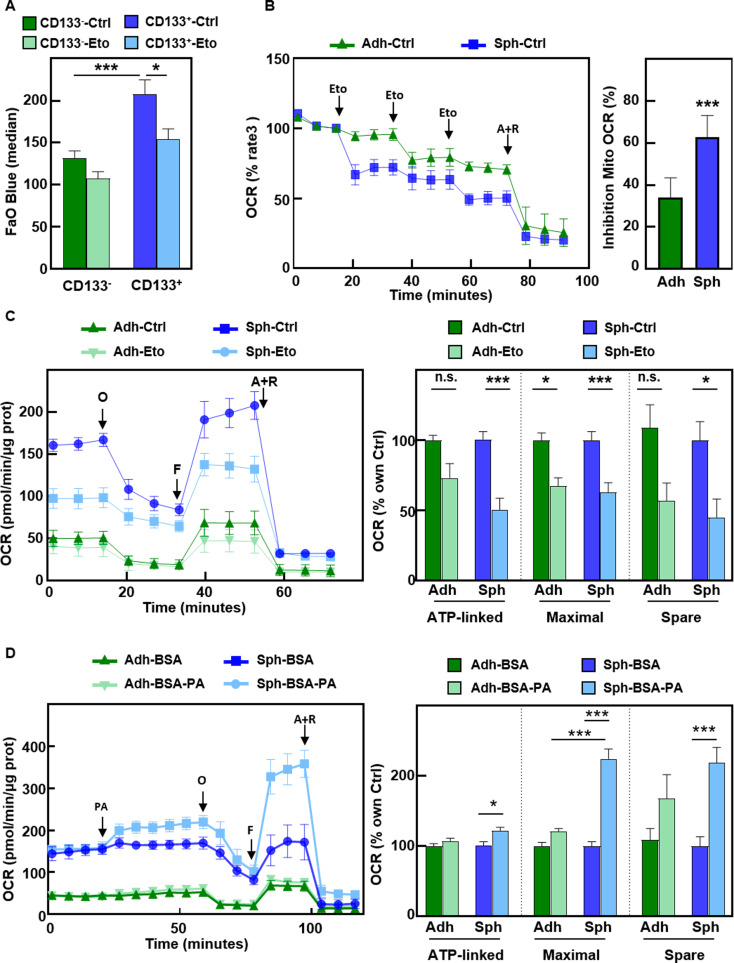
PaCSCs show enhanced mitochondrial FAO. (A) Median fluorescence intensity of FAO Blue staining as assessed by flow cytometry in cells gated for CD133 expression. Pooled data for PDX185 and 354 cells. (B) Oxygen consumption rate (OCR) by Seahorse analysis upon consecutive injections of 40 µM Etomoxir (Eto) and a final injection of the complex III inhibitor Antimycin A and the complex I inhibitor Rotenone (A + R, 1 µM). Left panel, kinetics in adherent vs. sphere-derived PDX215 cells. Right, percentage of mitochondrial OCR inhibition by Etomoxir, with respect to A + R, considered as 100% inhibition. (C) Long Chain FAO Stress Test in adherent and sphere-derived PDX215 cells pre-treated for 30 min with Etomoxir. Left, OCR kinetic profile. O, ATP synthase inhibitor Oligomycin; F, mitochondrial oxidative phosphorylation uncoupler FCCP. Right, ATP-linked and maximal respiration, and spare respiratory capacity, shown as percentages of the control for each condition. (D) Palmitate Oxidation Stress Test in adherent vs. sphere-derived PDX215 cells upon injection of palmitic acid conjugated with BSA (BSA-PA, 100 µM). Left panel, OCR kinetic profile. ATP-linked, maximal respiration and spare respiratory capacity are shown as percentages of the control for each condition. The data are presented as mean ± SEM of at least three independent experiments. * p < 0.05; *** p < 0.001

