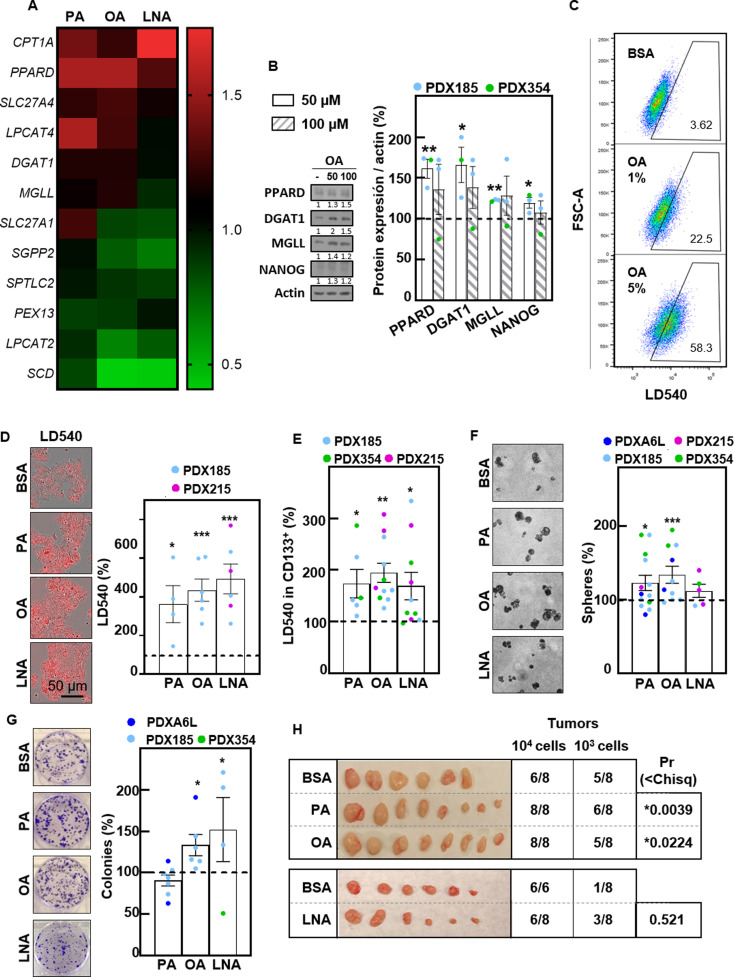
Fig. 4.
Fatty acid supplementation enhances CSC functionality. (A) Gene expression determined by RTqPCR of the indicated genes after 48 h of treatment with palmitic acid (PA) (50 µM), oleic acid (OA 100 µM) or linolenic acid (LNA) (200 µM). (B) Western blot analysis of PPARD, DGAT1, MGLL and NANOG after 48 h of treatment with OA at 50 and 100 µM. Left, representative experiment in PDX185. Right, densitometric analyses of Western blots from PDX185 and PDX354. β-Αctin was used as loading control. (C) Representative flow cytometry plots of LD540 for PDX253 cells treated with increasing concentrations of OA (1 and 5%) for 24 h. (D) LD540 staining by IncuCyte imaging for PDX185 cells upon treatment with PA, OA or LNA as indicated in A. Left, representative images. Right, quantification, calculated as a percentage of the control conditions. (E) LD540 staining by flow cytometry in CD133+ cells from the indicated PDX models treated as described in A. (F) Sphere formation after seven days of treatment with PA, OA or LNA. Left, representative phase contrast images. Right, quantification, shown as a percentage of the control conditions. (G) Colony formation after 21 days of treatment with PA, OA or LNA. Left, representative images of colonies stained with crystal violet. Right, quantification of colony number, shown as compared percentage of the control conditions. (H) In vivo ELDA upon injection of the indicated number of PDX185 cells pretreated with PA, OA or LNA as indicated in A. Pictures of the tumors at the endpoint. ELDA calculations were performed on https://bioinf.wehi.edu.au/software/elda/. The data are presented as mean ± SEM of at least three independent experiments. * p < 0.05; ** p < 0.01; *** p < 0.001

