Fig. 5.
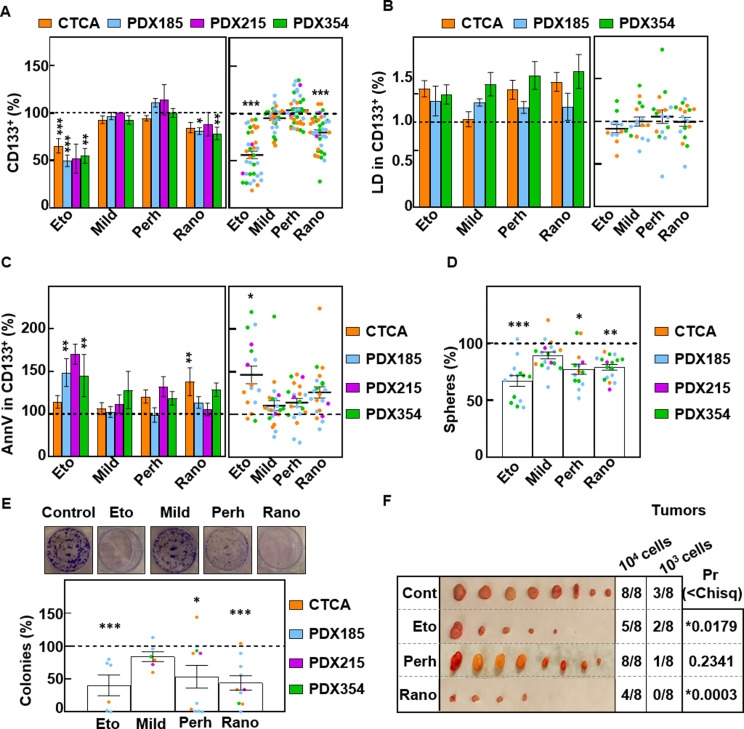
FAO inhibition impairs PaCSC functionality. Unless otherwise specified, the cells were treated for 48 h with Etomoxir (Eto) (200 µM), Mildronate (Mild) (100 µM), Perhexiline (Perh) (1 µM) or Ranolazine (Rano) (100 µM). (A) Percentage of CD133+ cells by FACS. (B) LD540 staining of CD133+ cells. (C) Annexin V staining in CD133+ cells. Left panels, mean value of each cell type. Right panels, pooled data. (D) Sphere formation assay after seven days of treatment with the inhibitors. (E) Colony formation assay after 21 days of treatment with inhibitors. Upper panel representative images of crystal violet staining of PDX185 cells. Lower panel, colony number quantification. (F) Tumors at the endpoint after the inoculation of pretreated PDX185 cells. ELDA calculations were performed at https://bioinf.wehi.edu.au/software/elda/. The data are presented as mean ± SEM of at least three independent experiments. The dashed lines represent the control conditions. * p < 0.05; ** p < 0.01; *** p < 0.001

